December 7, 2015

Row-level access in Qlik Sense using custom properties in QMC

Unlike its predecessor QlikView, QlikSense has a very robust and flexible rule-based security engine that allows setting up access restrictions in a centralized fashion using QMC (Qlik Sense Management Console). However, one important thing is still missing, and it's row-level data access. You're supposed to use Section Access, a QlikView relic which has only one good feature -- it works.

Luckily, it is possible to set up row-level access right from QMC, leveraging all the power of centralized security management. It's not completely official, since it requires accessing QSR (Qlik Sense Repository) directly, although it is possible to encapsulate the logic in a reusable script thus making future maintenance easier.

Here is how it works:

In QMC we create a custom property (e.g. MyCustomProperty) with some possible values (e.g. "MARKETING" and "FINANCE"). Now, the QMC will have a new property on a user page - MyCustomProperty, which can be defined as MARKETING, or FINANCE, or their combination (or nothing at all). These values are stored in QSR (the repository).

Since QSR is a PostgreSQL database we can connect to it in a Qlik Sense application and create Section Access that will use the custom property values for dynamic data reduction.

To make it work, first, connect to your Qlik Sense repository.

The repository data model contains 100+ tables however we need only three of them:
  • Users
  • CustomPropertyDefinitions
  • CustomPropertyValues

Subset of QSR data model

Here is the SQL query, needed to extract and join all the three tables to form Section Access.

SQL SELECT
    CASE WHEN
        //RootAdmins can always see everything
        usr."RolesString" LIKE '%RootAdmin%' THEN 'ADMIN'
        ELSE 'USER'
    END as "ACCESS",
 

    upper(val."Value") as "REDUCTION",
 

    upper(usr."UserDirectory") || '\' || upper(usr."UserId") as "USERID"

FROM "QSR"."public"."CustomPropertyDefinitions" def 


    LEFT JOIN "QSR"."public"."CustomPropertyValues" val
        ON def."ID" = val."Definition_ID"
       
    LEFT JOIN "QSR"."public"."Users" usr
        ON usr."ID" = val."User_ID"
       
    WHERE def."Name" = 'MyCustomProperty' and val."Deleted" is false
    ;

The query creates Section Access with three columns:
  • ACCESS
  • USERID
  • REDUCTION
For every combination of user and its custom property value it creates a new row in Section Access, where REDUCTION corresponds to the values. The query also assigns ADMIN access to all RootAdmins in QMC (just in case). Everyone else gets USER access.

Now, include field REDUCTION (make sure its values are upper-cased) into your application data model, and Section Access will leave only rows where REDUCTION in the data model is the same as REDUCTION in Section Access for the current user, thus enforcing row-level data access.

A few gotchas:

1. To change permissions for a user -- change his/her MyCustomProperty in QMC, and reload the application (Section Access will keep old permissions until reloaded).

2. If you need to have users that have to access all data, but they are not RootAdmins, you will need to explicitly add all possible values of the custom property for the user, because in Qlik Sense its Section Access works in strict mode. You can do it manually, in QMC, but that's not convenient. Much easier is to create a new value (e.g. EVERYTHING), and then for users with this value assigned automatically create rows with all possible values (excluding EVERYTHING). QSR stores all possible values of a custom property in field "ChoiceValuesString" of table
"CustomPropertyDefinitions". All properties are stored together in one text field, separated as below:
FINANCE:,:MARKETING:,:EVERYTHING
In order to create a list from this line of text the following query can be used:
LOAD
    Subfield( [ChoiceValuesString], ':,:') as REDUCTION
;
SQL SELECT
    "ChoiceValuesString"
FROM "QSR"."public"."CustomPropertyDefinitions" def

    WHERE def."Name" = 'MyCustomProperty';
Once you get the list of values you can append it to the Section Access created previously.

3. To make Section Access work in scheduled reload tasks you must add the scheduler's account to Section Access:
CONCATENATE (YourSectionAccessTable) LOAD * INLINE [
ACCESS, USERID,REDUCTION
ADMIN,INTERNAL\SA_SCHEDULER,*
];
 4. You can wrap entire Section Access script into a common reusable script and insert it into applications using something like:

$(Must_Include=lib://SectionAccess/section_access.qs)

In this case even if Qlik will change QSR's data model you can only adjust your reusable script to make it work for all applications that use it.

UPDATE 12/14/2015

5. Before reloading an application to apply changes in Section Access make sure you close all browser tabs opened with the application (Load Editor, Data Model, etc.). Otherwise, you might get unpredictable behavior. Also make sure you reload applications with Section Access every time you changed custom properties for a user because Section Access keeps a subset of old repository data.

November 4, 2015

800 transformations

Today one our customer showed me an EasyMorph project that they run every day. It has 800 transformations and performs consolidation of financial data received from multiple counterparties. These counterparties send data in non-uniform formats hence complex consolidation rules. We use some large projects internally at EasyMorph (these are test cases for functions and transformations), but the largest one has around 400-500 transformations (and I thought that was big). Here we have 800 and it didn't strike the customer as something unusual. Just a daily routine. Which led me to a few thoughts:

Apparently, the concept of modelling data transformations, that we use in EasyMorph, works rather well. Just to remind you, instead of connecting individual transformations with arrows (which is typical for the vast majority of ETLs), transformations in EasyMorph are organized into something like function pipelines, where output of a transformation implicitly becomes an input of a following transformation (see how it works on http://easymorph.com). This eliminates the need to explicitly define data flow between transformations with arrows. Imagine what a mess such project would have been if it had 800 arrows, connecting 800 blocks!


This approach allows EasyMorph to pack transformations much more densely than traditional tools, and operate with logical blocks of transformations, rather than individual transformations, which provides a higher level view and abstraction. This makes EasyMorph conceptually closer to [functional] scripting languages than to ETL, but since it's highly visual working with EasyMorph feels more like working with a spreadsheet, rather than programming. It's worth noting that it took the customer only a few days to create the project, not weeks or months -- yet another confirmation that visual designing works better than scripting.

The more examples of use I see, the better I understand (and I maybe only a few steps ahead of our users in this regard) what's the best positioning of EasyMorph. It now is becoming clear that it's rather well suited for modelling complex and very complex business logic on moderate amounts of data (much more complex then I initially supposed). The picture below illustrates this:

Here we have two axis -- amount of data (vertical) and complexity of business logic (horizontal). Nowadays, everybody is talking about Big Data and looking for ways to handle large data volumes, since it's increasing exponentially (at least that's what we're told). EasyMorph targets a problem orthogonal to Big Data -- it addresses complexity of business rules, offering ways to easily design and maintain rather complex logic, using approaches and transformations that sometimes simply not possible for SQL-based tools.

And it looks like it works. 800 transformations.

PS. I usually have difficulties explaining people what EasyMorph is because there is no commonly accepted terminology that can be used for it. Is it ETL? Kinda yes, but, emmm.... not really. Actually, not at all. It's a bit like programming, but without programming... Like Excel but for tabular data...Well, it would be easier to just show it to you.

September 20, 2015

The Data Warehouse Myth

We all know the concept of data warehousing: take data from various sources, cleanse it, transform it, load it into a relational database, make it uniform and accessible by SQL-based BI-tools in order to create a single, holistic view of an organization's performance. Thousands of projects teams try to build this every year. Thousands of consulting companies offer this service. I've been doing this for more than 12 years.

Now I realize it's a myth.

It's never possible to bring everything needed into a data warehouse. If your business is not big, you probably can bring together 90% of your data. Some 10% will always remain somewhere outside. There are many reasons why important data stays outside: it could simply not exist when you started building your data warehouse, or business requirements changed while you were building it, or one of your source systems got replaced with another one, or a new business line opened, and so on. This makes data warehouses expensive never-ending projects that never reach their goal of becoming a single, holistic data source. If your organization is large, your data warehouse might even not cover 40% of your organization data analysis needs.

Having expensive long-term projects that never reach their goals isn't very reasonable, is it? But why is this happening?

First, the assumption that "if it works for some our data then it should work for all our data" turns out to be wrong. Indeed, once you've successfully built a small analytical database that covers some of company's business (which is totally doable) it's very tempting to start thinking "now let's buy a bigger server and put everything into this thing". But what works locally doesn't always work globally. A data warehouse is a tightly coupled system. The more you try to extend tight connections, the more effort and money required for it, and it grows exponentially. At some point it's not reasonable anymore to keep everything in a tightly coupled system. This happens earlier than many expect.

Second, the reliance of existing BI tools on SQL doesn't leave much choice to information system architects. Popular BI systems like BusinessObjects, Cognos or Tableau can do well only one type of querying -- generate an SQL SELECT query with aggregation and filters (where/having conditions) and send it to a relational database. I call this single-step analytics (see "Transformational data analysis"). That's the only type of querying users can do with these tools. There are no good, user-friendly querying tools that would step out of this concept. The entire BI industry was tailored to the myth of data warehousing. Now it has become a power that forces architects for follow the myth.

OK, how to escape it? Here is my hypothesis:

If something big can't work as a tightly coupled system -- make it loose. Instead of forcing everything into strict global order, create order locally. Build small databases for subject areas (e.g. general ledger or customer loyalty programs) if needed, create collections of uniform files (without loading them into a database), pre-aggreggate data when necessary, etc. Make sure data is kept in order locally. Yes, this is very much like those "silos" that the data warehousing prescribes to avoid. Except that they are ordered, explorable, and ready for querying.

Second part of the hypothesis is more difficult as it requires something that doesn't exist yet -- user-friendly, visual , not SQL-based tools that can query, combine in multiple steps, and visualize data from various types of "silos". At small scale this can be done with EasyMorph. But for large amounts of data such tools should work in a distributed environment.

Finally, embrace the concept of "data kitchen". It's not possible to cover all data analysis needs of a big user group with a single BI system. The idea of BI standardization which was popular 5-7 years ago has failed. Having a single tool will never be enough. Instead, users should be offered on demand a choice of tools for various kinds of tasks. Think of "spoon", "fork" and "knife" of data analysis.

PS. Some readers can mention Apache Hadoop. While it looks like a step in the right direction (a loosely coupled system) there still is a big issue with tools. For instance, the PIG scripting language is powerful, but the whole idea of writing scripts is totally not user friendly. And no, putting Tableau on top of Hadoop won't make the trick as Tableau (or any other SQL based tool) is a tool from the Data Warehouse Myth.

August 18, 2015

Transformational data analysis

Single step analytics
The vast majority of BI or Data Discovery tools follow the same approach for data visualization and analysis. I call it 1-step analytics or single pass analytics. In the foundation of this approach there is a single logical data set consisting of one table, or several linked tables. Sometimes it can span across several data sources, but from a user's perspective it's still a single data set or cube. In order to perform analysis a user interacts with different parts of this data set. Visual objects of a report or dashboard are usually built on top of a subset of this data model, or microcube. In another words, under any chart or table in a report or dashboard there is a microcube. In a standard case, every microcube is obtained by filtering or aggregating data from the main cube, usually on the fly. Some BI tools allow users freely change measures and dimensions of microcubes on the fly (query&analysis tools like BusinessObjects or Tableau). Sometimes microcube metadata is fixed during design time and users can only filter data in it (Qlik). But in any case these microcubes are derived from the main cube. So there is only one step (pass) -- derive a microcube from the main cube.

Single-pass analytics

To derive a micro-cube typically 4 operations are used:
  • Select columns -- take only certain columns from the main cube
  • Filter -- keep only rows that satisfy some rule or condition
  • Aggregate -- calculate aggregates like sum or count, grouped by some dimensions
  • Calculate new columns -- calculate new measures or dimensions using a formula
 When users perform analysis they actually force BI tools to recalculate microcubes on the fly, using different parameters. For instance, when you drill down from year to month you tell your BI tool to select different columns (add month), apply a different filter (fix year), and aggregate by a different dimension (month instead of year). The power of BI is in the fact that all these operations are performed automatically by a single click. Whatever you, as user, do -- your BI tool automatically does these 4 operations under the hood.

So far, so good. Is anything wrong with this?

Multi-step analytics

For many users and cases, single step analytics is totally sufficient. Remember the times when all users had was just static reports. Probably we could've called that zero step analytics :) So the current state of affairs is a great improvement compared to those times.

But for many cases (and users) it's not enough. In the real life there are many business rules and types of analysis that can not be covered with only single pass. They need two or more passes in which microcubes are derived from another microcubes and not only from the main cube. For instance different kinds of customer behavior analysis require analyzing customer performance over a period of time (one pass), then grouping them based on this performance (another pass), and finally obtaining performance of the groups over the same or different time period (third pass). Example: for a retail chain it's important to see growth of their customer base and not just growth of sales. For this, the organization might analyze how many new customers every month became permanent buyers. But in order to understand if a customer that joined in, say, March is permanent, it's necessary to analyze his/her purchases from April to, say, October. And only then we can come to conclusion that, for example, 3% of new customers joined in March became permanent. And then calculate the same for all months. And then let the user experiment. For instance, modify the rule how we consider a customer permanent -- change it from "1 purchase over 3 months" to "2 purchases over 6 months", and see what happens.

Multi-step analytics

Number of cases when users need ad hoc multi-pass analytics will only grow because as organizations learn more about their customers, they slowly move from basic metrics like number of orders or total revenue to more sophisticated performance indicators that monitor key drivers of business.

You might argue that the type of tasks I described above is not unheard of, and is typically solved by the means of ETL. That's true. The common wisdom across BI developers is try to pre-calculate everything that cannot be calculated on the fly. Move it into ETL. But this doesn't really work because ETL is static. Well, it's not static for a developer, but for a user it's static. The reason it's static for the user is because designing ETL requires technical skills and users don't have them (and shouldn't have). You know how users get around this problem? They do ad hoc ETL in Excel. Yes, it's horribly inconvenient, very error prone, and requires a lot of tedious manual work, but what else can they do? They simply don't have a choice. At least Excel is something they are comfortable with.

ETL today is the same thing as static reporting was before BI started to prosper. I believe it will change with transformational data analysis.

Transformational data analysis

We've used to the fact that ETL and BI are different beasts. It's like a dogma. But what if the borderline between BI and ETL is somewhat artificial and shouldn't be that distinct? I'm not talking about low-level ETL that for instance integrates legacy systems. I'm talking about these parts of business logic that are moved to ETL simply because current BI tools can't handle it.

So, I'm proposing a new term -- "transformational data analysis". It's a way to analyze data through ad hoc data manipulation and multi-step analytics built as series of transformations. It effectively eliminates the difference between BI and ETL (in its business logic part).


EasyMorph (http://easymorph.com), the tool I've been working on since 2013, follows the concept of transformational data analysis. It allows non-technical users to build multi-step analytics using more than 20 various transformations (not just 4), and then re-run it with different parameters and modify it on the fly. At this point EasyMorph doesn't look like a traditional BI tool in that sense that it doesn't have interactive charts or pivot tables (yet!), but we're getting there.

PS.

Can Qlik do multi-pass analytics?
QlikView (and Qlik Sense) is somewhat different from most BI tools (including Tableau) in that sense that it allows going slightly beyond the 1-step limit. The set analysis feature allows building rather complex filtering conditions that might include the element functions ( P() and E() ) which can be considered a 2-step logic. Also, with the help of aggr() function you can add an extra aggregation step. But there are plenty cases where they can't help. And even if they can help, designing expressions with set analysis and aggr() is a huge hassle (I did it for years) and hardly can be considered user friendly or suitable for ad hoc workflow. To be fair we can assume that Qlik allows 1.5-step analytics.

UPDATE 16/3/2016
Starting from version 2.8 EasyMorph offers dynamic drag-and-drop charts for interactive data visualization and more than 50 transformations.

UPDATE 9/8/2015
Interesting comment from Christophe Vogne:

Hi Dmitry,

Reading again your article I understand better what you mean.
From my perspective you are highlighting the fact that BI is moving from multidimensional database to graph database.
Multidimensional database need to be strongly structured and this design break the hidden links between information if they haven't been considered.
With kimball/Inmon BI method, there's always somebody that decide for you what you are supposed to discover: the datawarehouse team and their cascading cubes, datamarts...
QlikView is 1.5 because it's a tabular database (the fields values storage) on top of a graph database (the pointers layer that make the links between values). So some lost associations can be rebuilt by users.

So one aspect of the BI future is graph database because users need to link any information in any context at any time.
But to aggregate values on graph database is a tough challenge (the Set Analysis) and to manage multiple edges between vertex (the synthetic keys) is tougher.

Interesting article indeed

June 23, 2015

12 similarities between EasyMorph and QlikView loading script

Here are a few analogies that can help QlikView users become more familiar with data transformation concepts in EasyMorph:

In-memory data transformation

Both QlikView and EasyMorph don't require an external database to transform data. Instead, they rely on their own in-memory engines. In QlikView the data transformation part of the engine is single threaded. EasyMorph's engine is multi-threaded but less memory efficient. Both EasyMorph and QlikView use data compression.

Mixed value types in one column

Like QlikView, EasyMorph can mix text values and numbers in the same column, which makes it an excellent visual tool for parsing Excel spreadsheets. Although, type system in EasyMorph is a bit different.

Transformations in EM are similar to preceding loads in QV

In QlikView's preceding loads one load statement is based directly on the result of another load statement, which sometimes is convenient. Transformations in EasyMorph are somewhat similar to preceding loads in QlikView in that sense that a transformation directly uses the output of its previous transformation as input, without any intermediate (resident) tables. While in QlikView you can't do much in preceding loads -- only calculate new columns, and de-duplicate data (using DISTINCT), in EasyMorph you can use any of 25+ transformations (including filters, sorts, and even joins) in any order. Basically, all transformation process in EasyMorph is designed like super-powerful preceding loads.


Little things like the ability to replace existing column with an expression (instead of calculating new column, dropping the old one, and renaming) make life easier. And no annoying script errors because of a missed comma that cause aborting and reloading entire application.

Variables

Variables are ubiquitous in QlikView loading scripts and sometimes used up to the point where entire parts of script are replaced with a variable. The closest (although not exact!) analogue to variables in QlikView are project parameters in EasyMorph. Parameters are global. They don't change from transformation to transformation. Parameters can be used in transformations instead of file names and other properties, and also in expressions as constants.

Loops and iterations

Loading several files or processing a list of dates can be done using loops in QlikView, or iterations in EasyMorph. Although, the loops are imperative (as is the loading script syntax), while the iterations follow the functional programming style.

QVDs

No wonder QlikView can read/write QVD files. But so does EasyMorph. QlikSense QVDs are not supported yet (as of version 1.8) -- we're expecting Qlik to publish a respective API.

Calendars

Almost every QlikView / QlikSense application requires a calendar. If you're lucky to use Rob Wunderlich's QlikView Components then calendars might be easy for you. But for EasyMorph users it's even easier as it has built-in Calendar transformation that creates a calendar in a few clicks. See below an example of Calendar transformation, and its result.

Click to zoom

Mapping tables

Mapping table is a special temporary two-column table in QlikView. In EasyMorph any table can be a mapping table when it's used in Lookup transformation (equivalent to MAP USING... in QlikView). At this point (ver.1.8) in EasyMorph there is no analogy to ApplyMap function in QlikView.

Resident tables

In QlikView you can create new tables based on previously loaded, so called resident tables. In EasyMorph for the same purpose you can use derived tables. A derived table is like a dynamic copy (or view) of another table. It updates automatically if the original table changes. You can derive multiple tables from one table.

Derived tables in EasyMorph. Click to zoom.

Keep / Exists

Sometimes it's necessary to filter one table based on values in another table. In QlikView it can be done using either KEEP statement or WHERE clause with EXISTS() function. In EasyMorph the same can be achieved using Keep Matching or Keep Mismatching transformations.

Crosstable Load

Unpivot transformation in EasyMorph is the equivalent of CROSSTABLE LOAD in QlikView and can be used for transforming matrix tables into straight tables.

Command-line mode

Both QlikView and EasyMorph can be run in command line mode. Both applications allow defining variables (parameters) from command line. Here is EasyMorph's command-line syntax.

As you can see there are quite a few similarities. While in general QlikView loading script is more flexible (as you would expect from a programming language), designing transformations in EasyMorph is simpler, faster, and can be done by people without programming skills at all.

To learn more how EasyMorph works take a look at our illustrated PDF tutorials.

PS. One more similarity will appear in future releases -- the analogue of subroutines.

PPS. Totally forgot about resident/derived tables. Now it's 12 similarities :)

June 17, 2015

The world needs an open source columnar data file format

It's now common wisdom that storing data in columns is more convenient for analytical systems, than dealing with row-based data. Columnar databases like Vertica or VectorWise are getting widely adopted. Analytical in-memory engines are almost always columnar. QlikView stores data in QVD files in a columnar format, and I suspect that Tableau Data Extracts are columnar as well. EasyMorph is also running a columnar in-memory engine.

Usually, we see ETL processes that move data from row-based transactional systems into either row-based databases, or into columnar databases or analytical engines. In other words, the transfers are row-based to row-based, or row-based to columnar. But now, when columnar data stores become more and more widespread, the need to move data from one columnar system to another columnar system (i.e. columnar-columnar) will arise more and more often. And here is a problem -- if we do it in the usual way it's highly inefficient.

The reason it's inefficient is that columnar data is usually compressed. Therefore, passing a columnar dataset from one system to another system usually requires decompressing it entirely, than exporting it into some row-based format like CSV and then compressing again in the target system. Doesn't sound very efficient, does it?

To my knowledge (correct me if I'm wrong) at this point there is no any publicly available columnar data interchange format. For some reasons (which I don't really understand), all major vendors keep their columnar data formats proprietary, as if it was rocket science. I believe that if, for instance, Qlik made their QVD format open-source, then it could become a de-facto standard, simply because there is no any other common columnar data format. But as the vendors keep ignoring this opportunity, I believe there is a need in an open source format. Here is what it could be:

1. Columnar. Values are grouped into columns. A dataset can consist of one or more columns.

2. Extendable. Every column can be of one of predefined types, and these types encapsulate all logic required to read/write a column. Types can be:
  • Uncompressed
  • Vocabulary compression
  • RLE compression
  • Zipped
  • etc.
New versions of the format can include new column types, and preserve existing ones thus enabling backward compatibility.

3. Mixed/Strict typing. Some columns can have values of mixed types (e.g. text and numbers), some can be restricted to one type only.

4. Single-file/multi-file. Metadata and data can be in the same file (which is good for portability). Or metadata and columns (or parts of columns such as vocabularies) can be separate files (which can allow, for instance, sharing vocabularies between different columns and even tables).

5. Null-friendly. CSVs can't store nulls. This format should be able to support nulls natively.

I believe such format would make columnar-to-columnar data transfers more efficient. It won't eliminate decompressing/compressing entirely, but:
  • It would be possible to transfer only needed columns
  • In case where both source and target systems support the same column types (e.g. vocabulary compression) encoding/decoding can be either greatly optimized or avoided entirely
  • Metadata would be pre-calculated and available at low cost (e.g. number of rows, existence of nulls, etc.).
  • Columnar format makes parallel processing much simpler and more efficient

As the result -- data transfers can be 10x-100x times faster. One common format means we need not N x N data converters, but only N. Standardization would also foster a tool ecosystem around it -- viewers, profilers, converters, etc. Single documentation. Single API.

At this point it's just an idea. But if we at EasyMorph ever decide to make a persistent storage for our in-memory engine, I don't see any reasons why not make it open-source.

It's not rocket science after all.

UPDATE 17 Feb 2016
Two open-source projects aimed to standardize columnar data exchange - Apache Parquet (persistent store) and recently announced Apache Arrow (in-memory store).

June 14, 2015

EasyMorph as a visual functional programming language

If you're familiar with functional programming you might have noticed that EasyMorph is actually a functional programming language. Unlike general-purpose functional languages like Lisp or OCaml/F# it doesn't have writable code because it's visual. But it has many of the core features of functional languages:

Type system

EasyMorph's type system is rather primitive:
  • Dataset -- a set of columns that represents a table state before or after a transformation
  • Transformation properties -- a group of various transformation properties like file name, expression, boolean flag, etc.

    Immutable identifiers

    As in any other functional language, EasyMorph doesn't have variables. Instead it binds values to immutable identifiers. In our case identifiers can only be bound to datesets and project parameters which substitute some transformation properties.

    Functions

    Every transformation in EasyMorph is basically a function. It takes one or two datasets and/or a set of transformation properties as arguments, and returns one dataset. For instance:

    let A = Deduplicate B

    Since an EasyMorph project can have parameters, that makes entire project a function as well, where the parameters are the function arguments. In this case, the returned value is a dataset. While in programming languages a returned value is usually the last expression, in EasyMorph project the resulting table is simply marked with a flag, and its final dataset is returned to the calling project.

    Function pipelining

    Functions (transformations) can be pipelined (chained):

    let A = ImportText fileName
            |> Filter (fun x -> x.Year = 2015)
            |> Deduplicate
            |> Trim 10 topRows

    Iterate, map and fold

    Iterations in EasyMorph actually perform iterations, mapping and folding:

    When Iterate transformation is used in Iterate mode it's basically similar to Seq.iter or Seq.map in OCaml/F#

    When Iterate transformation is run in Iterate & Append mode it's somewhat similar to Seq.map |> Seq.fold as it creates multiple datasets, and then concatenates them into one dataset.

    Function values

    In functional languages functions can be passed as parameters. In EasyMorph one project can run another project and name of that other project can be defined by a parameter, which basically allows passing functions (projects) as parameters to other functions (projects).

    Resume

    Of course, this analogy is not very strict and it has many limitations. For instance there is no any equivalent of recursion which is a corner stone feature of functional languages. Nevertheless, it gives some interesting ideas on how a transformation process can be organized in EasyMorph. For instance, it should be convenient to compose transformation processes from smaller reusable projects (should we rather call them modules?). Also such functional approach makes developing and debugging easier, as it's possible to split the logic into small relatively isolated functions that don't have side effects.

    If you find this analogy interesting and would like to discuss it -- feel free to shoot me an email.

    UPDATE (8/30/2015)
    One more similarity appeared recently:

    Assert 

    Halt on condition transformation is basically the same as assert statement in some languages. It stops project execution if some condition is unfulfilled and throws a customized error message.

    March 22, 2015

    Data transformation in QlikView without the loading script

    While I admire QlikView's genius associative in-memory engine I'm not a big fan of QlikView's loading script. If QlikView wasn't meant for departmental use, it would not have been a problem. But since QlikView is heavily oriented on business departments with limited IT supporting staff, the necessity to deal with transformation logic encoded in a proprietary script syntax is an obstacle because of several reasons:
    1. It makes it harder to promote QlikView in organizations, since readability of QlikView script is no better than of Visual Basic macros in Excel spreadsheets or SQL.
    2. Since business users usually can't write/read the scripts (they are not supposed to have programming skills), it inflates development and maintenance costs because even minor changes to the logic have to be made by developers and developers have to answer all questions about how this or that is calculated.
    3. Total lack of metadata lineage. To make it even worse, the dollar-sign expansions make it impossible to parse scripts and rebuild abstract syntax tree in external applications.
    With QlikSense the situation is even worse, because QlikSense is targeted as a self-service data discovery platform, but the need in loading script makes it dead on arrival.

    I believe that data transformation can be done without programming in the vast majority of cases. That's why I designed EasyMorph that can be integrated with both QlikView and QlikSense.

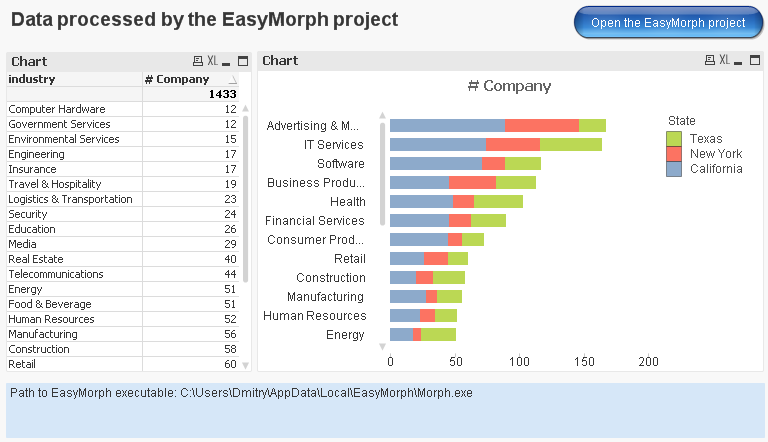
    Today we've published an example of QlikView Integration. It shows how data transformation logic can be moved from a QlikView loading script into an EasyMorph project, where it can be visually designed, modified and viewed. While it doesn't replace the loading script completely (yet) it demonstrates how core transformation logic can be made accessible for non-technical users, who can now explore and modify the logic in a visual way, without dealing with the script syntax.


    Here is its transformation logic. Input and output transformations are marked on the screenshot.


    The logic loads a text file (one file per state), maps state names from another file, does a few calculations and aggregations, and exports the result into a QVD file. Here is the loading script with EasyMorph project integration (comments removed, download the example for the full version):

    States:
    LOAD * Inline [
    State
    California
    New York
    Texas
    ];

    LET pathEasyMorph = GetRegistryString('HKEY_CURRENT_USER\Software\EasyMorph', 'ApplicationPath');

    let vCount = NoOfRows('States');

    FOR I = 0 to vCount - 1

        LET State = Peek('State', I, 'States');
       
        //create input file for the EasyMorph project
        EXECUTE cmd /C copy /Y "Inc5000 $(State).csv" input.csv;
       
        EXECUTE $(pathEasyMorph) /c /run "Inc5000 for QlikView.morph";   

        //read the QVD generated by the EasyMorph project
        LOAD
            *,
            '$(State)' as State
        FROM output.qvd (qvd);

    NEXT I


    Since EasyMorph can't process a list of files yet (this feature will be added in future releases) a simple workaround is used -- a cycle, that iterates through a list of file names, and renaming.

    For convenience the EasyMorph project can be opened right from desktop QlikView (in example there is a button for this).

    For server execution, you might need to specify the path to EasyMorph executable explicitly, since EasyMorph is installed under a user account and may not be available in the registry under QlikView Server's account.

    While it's not shown in the example, you can also add a link to the HTML documentation automatically generated by EasyMorph when it runs a project with /doc parameter from command line (see help on this). In this case users will be able to see the documentation right in the web-browser, next to the application. Or, right in the application, using an extension for web page embedding.

    Links:
    EasyMorph website
    QlikView Integration example

    PS. Technical details are copied from EasyMorph Blog.

    March 5, 2015

    EasyMorph as an ETL for Tableau

    Tableau is a great tool. I've been watching it for a few years and I like the way it's developing -- more sophisticated computations, better performance, faster visual engine. Tableau aims at analysts without technical background -- an audience which probably is most under-served in terms of tooling than any other category of office workers. All what they usually have for their data analysis needs is Excel, love it or hate it.

    At the same time I struggled to understand the conceptual breakthrough behind Tableau. While it's often considered a prominent Data Discovery platform, when it comes to data transformation it's not significantly less dependent on IT staff than traditional Business Intelligence platforms. Just as traditional BI, Tableau needs well prepared data, preferably residing in a database. And when it comes to data manipulation in databases all user-friendliness ends -- last time when SQL was user-friendly was in 1980s.

    In my understanding the reason why Data Discovery started outpacing traditional BI is that it can liberate business teams from dependency on IT folks. Data Discovery tools must be self-sufficient by definition. It means that users should be able to collect, clean, transform and prepare data for analysis themselves. And this is why they still love Excel -- because it makes it possible, because it lets them control. And that's why QlikView is more self-sufficient -- because it has its own ETL. While QlikView has its own pros and cons (personally I'm not a big fan of its loading script), but in vast majority of cases it has all you need to prepare data for analysis and visualization. But what about Tableau?

    I've designed EasyMorph, an easy-to-use ETL tool intended for exactly the same target audience as Tableau -- knowledge workers without a technical background. Like Tableau, EasyMorph is highly visual and it doesn't require SQL skills or programming. Like Tableau, it's fast and lightweight, and it doesn't demand weeks of training. My goal is to make EasyMorph a perfect companion for Tableau and allow Tableau to become a truly Data Discovery platform, owned by business users. Today EasyMorph made one more step towards that goal -- we've added support for Tableau Data Extracts.

    If you're a Tableau user, give EasyMorph a try -- maybe this is something that you were missing in your Tableau experience. Feel free to drop me a few lines with your thoughts on it. You can find my email in the right sidebar of this blog. Thank you!

    UPDATE
    In 2015 EasyMorph has become a Tableau Technology partner. It has got a server edition and deeper integration with Tableau Server.

    UPDATE #2
    Apparently Tableau understands the lack of built-in data preparations capabilities -- in October 2017 they've unveiled Tableau Maestro, a light-weight data preparation tool. You can think of EasyMorph as "Maestro on steroids".