What a future Business Intelligence can look like? Usually, I'm skeptical about "disruptive" ideas like natural language queries or automatically generated analytical narrations (although, I respect the research effort), but recently I saw something that for the first time looked really interesting, if you apply it to data analysis. I will tell what it is shortly, but first I have to explain my skepticism.
Typing in natural language queries won't work because it's no better than writing SQL queries. Syntax is surely different, but it still has to be learned. It doesn't provide the expected freedom, like SQL didn't. Besides unexpected syntax restrictions (which has to be learned by user), queries quickly become long and complicated. I played a bit with NLP (natural language processing) queries done in Prolog in my school years and have a bit of understanding of the complexities related to NLP.
This can be somewhat mitigated by voice input, however virtual assistants like Siri/Alexa/Cortana are built around canned responses so it won't work either, because analytical ad hoc queries tend to be very different, and they always have a context.
Now, here is the promising technology. It's called Viv and I highly recommend watching its demo (it's about 30 minutes):
Two things that make Viv different: self-generating queries and the the ability to use a context. This can potentially make voice-based interactive data analysis finally possible. Not only can a service like Viv answer queries, e.g. "How many new customers did we get since January", you should be able to make it actionable. How about setting up alerts, like this: "Let me know next time when monthly sales in the West region drop below 1mln. Do it until the end of this year"? Or, sharing "Send this report to Peter and Jane in Corporate Finance department". Such virtual data analyst can participate in meetings, answer spontaneous questions, send out meeting results -- all done by voice. Quite attractive, isn't it?
Data analysis is a favorable area for artificial intelligence because it has a relatively small "universe" where entities (customers, transactions, products, etc.) are not so numerous, and their relationships are well understood. If you ever tried to design or analyze a conceptual data warehouse model, then most probably you have a good picture of that "universe".
And it seems like right technology to operate with this "universe" might arrive soon.

Dmitry Gudkov's blog about Business Intelligence and Data Visualization
May 8, 2016
Hints and tips on using QViewer for inspecting resident tables in QlikView
Three years ago I wrote "How to look inside resident tables at any point of loading script". This technique proved to be quite successful and efficient, and was praised by many prominent QlikView developers since then.
This post is a round-up of some best practices of using QViewer for inspecting resident tables in QlikView, collected over the last 3 years:
Here is the most recent variant of the INSPECT subroutine:
SUB Inspect (T)
// let's add some fault tolerance
LET NR = NoOfRows('$(T)');
IF len('$(NR)')>0 THEN
// Table exists, let's view it
STORE $(T) into [$(QvWorkPath)\~$(T).qvd] (qvd);
EXECUTE "C:\<pathToQViewer>\QViewer.exe" "$(QvWorkPath)\~$(T).qvd";
EXECUTE cmd.exe /c del /q "$(QvWorkPath)\~$(T).qvd";
ELSE
//Table doesn't exist. Let's display a messagebox with a warning
_MsgBox:
LOAD MsgBox('Table $(T) doesn' & chr(39) & 't exist. Nothing to inspect.', 'Warning', 'OK', 'ICONEXCLAMATION') as X AutoGenerate 1;
Drop Table _MsgBox;
ENDIF
// Namespace cleanup
SET NR=;
ENDSUB
Installer of the next version of QViewer will be creating a registry key with path to QViewer, so the subroutine will be able to use the registry key to get location of qviewer.exe instead of hardcoded file path (kudos to Matthew Fryer for the suggestion).
INSPECT is quite helpful in verifying joins for correctness. For this, insert CALL INSPECT twice -- once before a join, and once after it. This will allow you to see whether the resulting table has more rows after the join than before, and check if the join actually appended anything, i.e. if appended columns actually have some data in them.
To find duplicates in a column -- double-click the column header for a listbox with unique values in that column, and then click Count in that list. On first click QViewer will sort values in descending order thus showing duplicate entries (which have counts > 1) at the top of the list. Checking a primary key for duplicates after a join can help detecting wrong joins.
To find duplicate rows in a table -- click "Morph It" to open the table in EasyMorph, and then apply "Keep Duplicates" transformation. You can also filter rows, if you apply "Filter" or "Filter by expression" transformation.
When you deal with wide tables that have many columns, you might need to find specific column. Press F5 to open Table Metadata, and then sort field names in alphabetical order. Another common use case for Table Metadata is checking whether columns have values of expected type. For instance if a column is expected to have only numeric values, its "Text count" should be 0.
To find a value in a column -- double-click the column header to open a list of unique values, then use the search field above the list. To locate the searched value in the main table, simply double-click the value in the list. Press F3 to find next match in the main table.
Currently, the search feature is somewhat obscured (as rightfully pointed by some users). We will be introducing a more convenient full table search in QViewer v2.3 coming out in June. Subscribe to our mailing list on easyqlik.com to get a notification when it happens.
This post is a round-up of some best practices of using QViewer for inspecting resident tables in QlikView, collected over the last 3 years:
Here is the most recent variant of the INSPECT subroutine:
SUB Inspect (T)
// let's add some fault tolerance
LET NR = NoOfRows('$(T)');
IF len('$(NR)')>0 THEN
// Table exists, let's view it
STORE $(T) into [$(QvWorkPath)\~$(T).qvd] (qvd);
EXECUTE "C:\<pathToQViewer>\QViewer.exe" "$(QvWorkPath)\~$(T).qvd";
EXECUTE cmd.exe /c del /q "$(QvWorkPath)\~$(T).qvd";
ELSE
//Table doesn't exist. Let's display a messagebox with a warning
_MsgBox:
LOAD MsgBox('Table $(T) doesn' & chr(39) & 't exist. Nothing to inspect.', 'Warning', 'OK', 'ICONEXCLAMATION') as X AutoGenerate 1;
Drop Table _MsgBox;
ENDIF
// Namespace cleanup
SET NR=;
ENDSUB
Installer of the next version of QViewer will be creating a registry key with path to QViewer, so the subroutine will be able to use the registry key to get location of qviewer.exe instead of hardcoded file path (kudos to Matthew Fryer for the suggestion).
INSPECT is quite helpful in verifying joins for correctness. For this, insert CALL INSPECT twice -- once before a join, and once after it. This will allow you to see whether the resulting table has more rows after the join than before, and check if the join actually appended anything, i.e. if appended columns actually have some data in them.
To find duplicates in a column -- double-click the column header for a listbox with unique values in that column, and then click Count in that list. On first click QViewer will sort values in descending order thus showing duplicate entries (which have counts > 1) at the top of the list. Checking a primary key for duplicates after a join can help detecting wrong joins.
To find duplicate rows in a table -- click "Morph It" to open the table in EasyMorph, and then apply "Keep Duplicates" transformation. You can also filter rows, if you apply "Filter" or "Filter by expression" transformation.
When you deal with wide tables that have many columns, you might need to find specific column. Press F5 to open Table Metadata, and then sort field names in alphabetical order. Another common use case for Table Metadata is checking whether columns have values of expected type. For instance if a column is expected to have only numeric values, its "Text count" should be 0.
To find a value in a column -- double-click the column header to open a list of unique values, then use the search field above the list. To locate the searched value in the main table, simply double-click the value in the list. Press F3 to find next match in the main table.
Currently, the search feature is somewhat obscured (as rightfully pointed by some users). We will be introducing a more convenient full table search in QViewer v2.3 coming out in June. Subscribe to our mailing list on easyqlik.com to get a notification when it happens.

May 1, 2016
Why I prototype Qlik apps in EasyMorph before creating them
If you want to create a Qlik app just create it, why would anyone build a prototype in another tool first? Isn't it just a waste of time? For simple cases -- probably yes, but for complex apps prototyping them first allows designing apps faster and more reliably. Here is why:
When developing Qlik apps with a complex transformation logic one of the main challenges is to deal with data quality and data structure of poorly documented source systems. Therefore the most time-consuming phase is figuring out how to process data correctly and what can potentially go wrong. There are many questions to answer during this phase, for instance:
This is where EasyMorph comes in handy. First, it loads data once, then keeps it in memory, therefore, it doesn't have to be reloaded every time. And if you load sample data only one time, why not use a bigger data set which is usually better for data profiling? Not only does EasyMorph load data only once, it also keeps in memory results of all successful transformations. So if an error occurs, you continue from where it stopped, not from the beginning -- another time-saving feature.
Second, EasyMorph runs transformations automatically in the background after any change. It's like if you are writing a Qlik script, and while you're writing it after any change or new statement Qlik runs the script proactively, without requiring you to press Reload. Except Qlik doesn't do it. Basically, transformations to EasyMorph is what formulas are to Excel -- you change one and immediately see a new result of calculations, regardless of how many formulas/transformations it took.
Third, designing a transformation process visually is much faster than scripting. Some Qlik developers are exceptionally good at writing scripts, but even they can't beat it when a whole transformation like aggregation is created literally in two clicks. If one knew exactly from the beginning what a script should do then writing it quickly would not be a problem. It's the numerous iterative edits, corrections and reloads that make writing Qlik scripts long. Once I have designed and debugged a transformation logic in EasyMorph, scripting it in Qlik is usually a matter of couple hours, and it typically works reliably and as expected from the 1st run.
Another important advantage of prototyping Qlik apps in EasyMorph is that it allows creating a reference result. When you design a Qlik application off an existing Excel or BI report it usually makes the task easier because numbers in the old report serve as a reference you can compare against. However, if you design a brand new report there might be no reference at all. How can you be sure that your Qlik script, expressions and sets work correctly? There is a whole lot of things that can go wrong. Building a prototype in EasyMorph gives you that reference point and not just for the script, but also for expressions, including set analysis. In airplanes, measuring crucial indicators like altitude and velocity must be done using at least two probes (for each metric) that utilize different principles of physics so that pilots can be sure it's measured correctly. The same principle here -- "get another reference point".
I also found that designing apps in close cooperation with business users is more productive when the users have good understanding of how a transformation logic works. It's better explained by letting them explore a visual process in EasyMorph rather than showing totally cryptic (for them) Qlik scripts.
Resume: EasyMorph is a professional tool which can be used by QlikView / Qlik Sense developers to create robust and reliable applications faster by prototyping them first. I do it myself, and so far it works pretty well.
When developing Qlik apps with a complex transformation logic one of the main challenges is to deal with data quality and data structure of poorly documented source systems. Therefore the most time-consuming phase is figuring out how to process data correctly and what can potentially go wrong. There are many questions to answer during this phase, for instance:
- How do we merge data -- what are the link fields, what fields are appended?
- Does any combination of the link fields have duplicates in one or the other table?
- Do the link fields have nulls?
- Are nulls actually nulls or empty text strings?
- Are numbers actually numbers, not text?
- Do text values have trailing spaces?
- After we join tables, does the result pass a sanity check?
- How can we detect it if the join goes wrong on another set of data (e.g. for another time period)?
- Are dates and amounts within expected ranges?
- Do dimensions have complete set of values, is anything missing?
- When dealing with data in spreadsheets
- Are text and numbers mixed in the same column? If yes, what is the rule to clean things up?
- Are column names and their positions consistent across spreadsheets? If not, how do we handle the inconsistency?
- Are sheet names consistent across spreadsheets?
This is where EasyMorph comes in handy. First, it loads data once, then keeps it in memory, therefore, it doesn't have to be reloaded every time. And if you load sample data only one time, why not use a bigger data set which is usually better for data profiling? Not only does EasyMorph load data only once, it also keeps in memory results of all successful transformations. So if an error occurs, you continue from where it stopped, not from the beginning -- another time-saving feature.
Second, EasyMorph runs transformations automatically in the background after any change. It's like if you are writing a Qlik script, and while you're writing it after any change or new statement Qlik runs the script proactively, without requiring you to press Reload. Except Qlik doesn't do it. Basically, transformations to EasyMorph is what formulas are to Excel -- you change one and immediately see a new result of calculations, regardless of how many formulas/transformations it took.
Third, designing a transformation process visually is much faster than scripting. Some Qlik developers are exceptionally good at writing scripts, but even they can't beat it when a whole transformation like aggregation is created literally in two clicks. If one knew exactly from the beginning what a script should do then writing it quickly would not be a problem. It's the numerous iterative edits, corrections and reloads that make writing Qlik scripts long. Once I have designed and debugged a transformation logic in EasyMorph, scripting it in Qlik is usually a matter of couple hours, and it typically works reliably and as expected from the 1st run.
Another important advantage of prototyping Qlik apps in EasyMorph is that it allows creating a reference result. When you design a Qlik application off an existing Excel or BI report it usually makes the task easier because numbers in the old report serve as a reference you can compare against. However, if you design a brand new report there might be no reference at all. How can you be sure that your Qlik script, expressions and sets work correctly? There is a whole lot of things that can go wrong. Building a prototype in EasyMorph gives you that reference point and not just for the script, but also for expressions, including set analysis. In airplanes, measuring crucial indicators like altitude and velocity must be done using at least two probes (for each metric) that utilize different principles of physics so that pilots can be sure it's measured correctly. The same principle here -- "get another reference point".
I also found that designing apps in close cooperation with business users is more productive when the users have good understanding of how a transformation logic works. It's better explained by letting them explore a visual process in EasyMorph rather than showing totally cryptic (for them) Qlik scripts.
Resume: EasyMorph is a professional tool which can be used by QlikView / Qlik Sense developers to create robust and reliable applications faster by prototyping them first. I do it myself, and so far it works pretty well.
March 11, 2016
Thoughts on Tableau acquiring HyPer
As it became known [1][2] today Tableau acquires HyPer -- a small German database company that created a high-speed in-memory hybrid OLTP/OLAP database engine. HyPer was founded by two university professors and has ten PhD students and alumni on board, four of which will be joining Tableau.
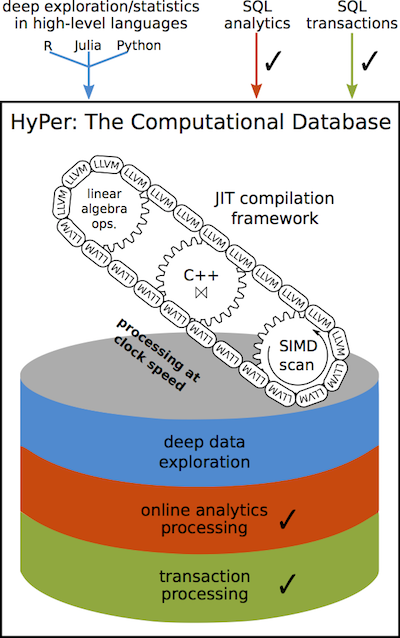
HyPer claims to have high performance in both transactional and analytical types of workloads, achievable even on ARM architectures. It uses many smart techniques like virtual memory snapshoting to run long and short queries on the same datasets, one-the-fly compilation of queries into low-level code, adaptive indexing, hot clustering for query parallelization and many others (see HyPer overview).
Does it mean that Tableau becomes a database company? Apparently no. First, because that's not what they do, and second, because HyPer is rather an academic technology research rather than a market-ready product.
To me this acquisition is very much like Qlik's acquisition of NComVa a few years ago. Let me explain it a bit:
NComVa was a small company that built interactive Javascript data visualizations. From what I understand Qlik Sense to some extent exploits the expertise acquired from NComVa. Qlik is very good at engineering highly optimized data engines, but academic data visualization and user experience is hardly can be counted as their core competence (I'll write a separate post on it). So Qlik needed some "brain injection" that led to birth of Qlik Sense.
With Tableau the situation is opposite -- their competence in data visualization and usability is outstanding, however high-performance in-memory data processing has never been a strong point in Tableau's agenda -- the idea was to piggyback existing relational DBMSes. To remind you, Tableau only recently switched to a 64-bit architecture and introduced multi-threaded query execution for their in-memory engine.
Therefore, the acquisition of HyPer is a long needed "brain injection" of top-notch data processing expertise. And it may change things significantly for Tableau customers, competitors and Tableau themselves.
I would suggest that in 1-2 years (not earlier) Tableau will introduce something like a super-cache -- the ability to hold big amounts of data (up to 1 TB or more) in memory, query it instantly with sub-second response times, and update in real-time.
Interesting questions are: whether it will require data modelling, how data will be loaded, and whether it will scale horizontally. The latter question is the most interesting, because Qlik, the closest Tableau's competitor, doesn't scale horizontally meaning that a single dataset can't be split across several nodes that are queried in parallel. HyPer hints at distributed data processing, so it could be possible that the "super-cache" will scale horizontally, which can be a big deal.
All in all, the acquisition is an intriguing twist of story. It will be interesting to see how it unfolds.
[1] http://www.tableau.com/about/press-releases/2016/tableau-acquires-hyper
[2] http://www.tableau.com/about/blog/2016/3/welcome-hyper-team-tableau-community-51375
HyPer claims to have high performance in both transactional and analytical types of workloads, achievable even on ARM architectures. It uses many smart techniques like virtual memory snapshoting to run long and short queries on the same datasets, one-the-fly compilation of queries into low-level code, adaptive indexing, hot clustering for query parallelization and many others (see HyPer overview).
Does it mean that Tableau becomes a database company? Apparently no. First, because that's not what they do, and second, because HyPer is rather an academic technology research rather than a market-ready product.
To me this acquisition is very much like Qlik's acquisition of NComVa a few years ago. Let me explain it a bit:
NComVa was a small company that built interactive Javascript data visualizations. From what I understand Qlik Sense to some extent exploits the expertise acquired from NComVa. Qlik is very good at engineering highly optimized data engines, but academic data visualization and user experience is hardly can be counted as their core competence (I'll write a separate post on it). So Qlik needed some "brain injection" that led to birth of Qlik Sense.
With Tableau the situation is opposite -- their competence in data visualization and usability is outstanding, however high-performance in-memory data processing has never been a strong point in Tableau's agenda -- the idea was to piggyback existing relational DBMSes. To remind you, Tableau only recently switched to a 64-bit architecture and introduced multi-threaded query execution for their in-memory engine.
Therefore, the acquisition of HyPer is a long needed "brain injection" of top-notch data processing expertise. And it may change things significantly for Tableau customers, competitors and Tableau themselves.
I would suggest that in 1-2 years (not earlier) Tableau will introduce something like a super-cache -- the ability to hold big amounts of data (up to 1 TB or more) in memory, query it instantly with sub-second response times, and update in real-time.
Interesting questions are: whether it will require data modelling, how data will be loaded, and whether it will scale horizontally. The latter question is the most interesting, because Qlik, the closest Tableau's competitor, doesn't scale horizontally meaning that a single dataset can't be split across several nodes that are queried in parallel. HyPer hints at distributed data processing, so it could be possible that the "super-cache" will scale horizontally, which can be a big deal.
All in all, the acquisition is an intriguing twist of story. It will be interesting to see how it unfolds.
[1] http://www.tableau.com/about/press-releases/2016/tableau-acquires-hyper
[2] http://www.tableau.com/about/blog/2016/3/welcome-hyper-team-tableau-community-51375
March 3, 2016
Are BI/ETL vendors ready for "data kitchens"? Because users are
If you've been in the BI/ETL industry for several years you may remember that many years ago BI/ETL vendors actively promoted the concept of so called "BI standardization". Gartner, Forrester and other market analysts also talked about it -- organizations should stop having "zoo parks of systems" and standardize on one platform. At that time even the big BI vendors were only transitioning from a single-tool client-server architecture to a multiple-tool web-based one and many hoped that once they complete the transition organizations would be able to cover their data analysis needs with a comprehensive product set (platform) from one vendor. These expectations were driven by high cost and complexity of the analytical systems at that time, so standardizing on one platform would facilitate building in-house expertise, lower maintenance costs, and simplify support and administration.
However, the reality turned out to be more complex. As a matter of fact it became clear that no vendor can offer really comprehensive product suite that would satisfy data analysis hunger of various types of users. The more users became involved into data analysis the more diverse and sophisticated needs they developed.
It seems to me that organizations are increasingly becoming ready to embrace the concept of "data kitchen" where users have a choice from many tools so that they can choose whether to use a "spoon", "fork", or "knife" for a job, rather than having just a "spoon" for all cases. However, the problem is that the vendors are not ready -- they still want customers to buy their expensive cumbersome enterprise platforms.
So what would be the difference between a "data kitchen tool" and an "old-school tool":
I guess the table above is self-explanatory. I would only make a couple notes:
Usability was long ignored but now it's the king. First, because data analysis is difficult, therefore I believe that software vendors should go the extra mile to design well thought out, clean and polished UI. Enterprise software should be smarter and simpler, even at a cost of removing some functionality (look at some popular mobile apps). Second, when you have many tools in your "kitchen" you can't afford spending a lot of time figuring out how to use each of them. A single tool may not require too much attention. Selfish ones don't survive in a team. Hence the necessity of open data formats and APIs. Open metadata is required for throughout data governance -- a must-have for a "data kitchen".
Another note is about price. Cost structure per user will change. If previously an organization could spend $5,000 for one license for one user, one should not expect that because of the "data kitchen" organizations will start buying 10 tools for the same $5K each spending in total $50K per user. Instead they will be looking to offer a user 10 tools for $500 each. I believe those software vendors that resist the change and keep prices high will be eventually squeezed out of the market.
You can check your favorite software against the table above. Some products are better suited to find a place in a "data kitchen", some are not. In my opinion Tableau is a good example of well thought out and polished user experience aimed for self-service use. I wish only they opened TDE and/or adopted some open format for data exchange. I hope EasyMorph can become another good example of a tool that is perfectly suitable for the "data kitchen" concept. We're living in an interesting time after all -- the BI/ETL market stagnated for long time, but now the pendulum has swung in the opposite direction and we can observe many interesting products coming to the market.
Isn't it great?
However, the reality turned out to be more complex. As a matter of fact it became clear that no vendor can offer really comprehensive product suite that would satisfy data analysis hunger of various types of users. The more users became involved into data analysis the more diverse and sophisticated needs they developed.
It seems to me that organizations are increasingly becoming ready to embrace the concept of "data kitchen" where users have a choice from many tools so that they can choose whether to use a "spoon", "fork", or "knife" for a job, rather than having just a "spoon" for all cases. However, the problem is that the vendors are not ready -- they still want customers to buy their expensive cumbersome enterprise platforms.
So what would be the difference between a "data kitchen tool" and an "old-school tool":
 |
| Click to zoom |
Usability was long ignored but now it's the king. First, because data analysis is difficult, therefore I believe that software vendors should go the extra mile to design well thought out, clean and polished UI. Enterprise software should be smarter and simpler, even at a cost of removing some functionality (look at some popular mobile apps). Second, when you have many tools in your "kitchen" you can't afford spending a lot of time figuring out how to use each of them. A single tool may not require too much attention. Selfish ones don't survive in a team. Hence the necessity of open data formats and APIs. Open metadata is required for throughout data governance -- a must-have for a "data kitchen".
Another note is about price. Cost structure per user will change. If previously an organization could spend $5,000 for one license for one user, one should not expect that because of the "data kitchen" organizations will start buying 10 tools for the same $5K each spending in total $50K per user. Instead they will be looking to offer a user 10 tools for $500 each. I believe those software vendors that resist the change and keep prices high will be eventually squeezed out of the market.
You can check your favorite software against the table above. Some products are better suited to find a place in a "data kitchen", some are not. In my opinion Tableau is a good example of well thought out and polished user experience aimed for self-service use. I wish only they opened TDE and/or adopted some open format for data exchange. I hope EasyMorph can become another good example of a tool that is perfectly suitable for the "data kitchen" concept. We're living in an interesting time after all -- the BI/ETL market stagnated for long time, but now the pendulum has swung in the opposite direction and we can observe many interesting products coming to the market.
Isn't it great?
January 30, 2016
The long tail of the information explosion
You have probably heard a lot about Big Data and everything related to it. However, Big Data is only one side of the explosive growth of digital information which we have been observing. The other side is often overlooked, while it can have no less disruptive influence on traditional BI/DWH landscape than Big Data.
The information explosion (it's a lame term but I'll stick to it in this post for simplicity) is usually perceived as and associated with rapidly growing size of data sets (transactional and semi-structured) up to the point where organizing it and querying it using traditional technologies becomes very inefficient or too costly.
Although the other side of the story here is amount of data sets. Let me illustrate it:
 |
| (click to zoom) |
Not only are data sets growing in volume -- they also are growing in number. New data sets are spawning with exponential rate. For every new system with large data volume there are tens of small data sets in spreadsheets, text files, web-pages and whatnot. That's why I call it The Long Tail -- these are myriads of small data sources, many of which are human-generated rather then machine-generated. What used to be a single number somewhere in email is becoming a list of numbers. What used to be a list is becoming a table. What used to be a table is becoming a data mart. These new data sets are relatively small, but there are lots of them and this represents a number of challenges:
First, building a single data warehouse is becoming less and less relevant because by the time when you have designed a data model and ETL processes to upload a new data set into a data warehouse there are two more new data sets and your data warehouse is obsolete and incomplete again. By the time when you upload these two there will be another four. Therefore, responsibility for data transformation should be more and more often given to business users (hint: EasyMorph can help with it).
Second, complexity of traditional ETL tools is becoming an obstacle because they were designed for relatively small number of transformation steps on large volumes of data, assuming that a lot of business logic will be handled by source systems. However, the growing number of new data sources requires designing exponentially more transformations in less amount of time with increasing share of embedded business logic.
Third, most BI tools by design require a single data model, usually a snowflake-type one. Users are not allowed to change the data model, they can only work with what was basically hardcoded by developers. While some tools allow users to merge new data sources this capability is usually very limited as it doesn't allow any data transformation prior to merging or after it, only basic manual data preparation. So no business logic can be applied on the fly. I wrote about this problem in more details in "Transformational Data Analysis".
Fourth, traditional BI/ETL tools are poorly suitable for dealing with Excel spreadsheets. Things like multi-line table headers, inconsistent sheet names, variable number of sheets often render these tools useless. For those who fought "spreadsheet hell" I have bad news -- the "spreadsheet era" is not over, despite all predictions. Instead, there will be more spreadsheets than ever, simply because there is nothing else that would allow non-technical users easily create and maintain small data sets. It's the most convenient and popular way so far. Microsoft may rejoice.
UPDATE
The same chart using linear scale instead of exponential one. This explains why Long Tail.
 |
| (click to zoom) |
January 25, 2016
EasyMorph product roadmap
 |
| click to zoom |
By version 3.0 EasyMorph will be a 3-in-1 tool for small and medium businesses, and enterprise data analysts. Its main features will include:
- New for the industry, "arrowless" data transformation design (already available in ver.2.5)
- Instant calculations -- calculations performed in the background immediately after any change
- Drag-n-drop line and bar charts
- Chart calculations that are done using the same transformations that are used for data transformation (in EasyMorph there is no difference between ETL and BI calculations)
- PDF reports with annotations on charts and tables
- Project parameters and "what-if" analysis capability
- Asynchronous calculations -- e.g. simultaneous database querying, file loading, aggregating and sorting
Subscribe to:
Posts (Atom)