I'm working on a concept of a new kind of ETL tool and I'm looking for one or two teammates (maybe future co-founders) to join our efforts and make it happen.
Background
The concept is about new data transformation tool intended for use by non-technical people. We observe the rise of Business Discovery tools like QlikView, Tableau, etc. that further simplify data analysis and visualization for people without technical background and I think there is an area where similar change is still waiting to happen -- business data manipulation and transformation. This task is traditionally "outsourced" to technical engineers who build complex ETL jobs by the means of SQL scripting or ETL-tools. However, in my opinion, this way of doing things doesn't match reality anymore:
First, there is a growing need for non-technical (a.k.a. "business-") users to manipulate data themselves. Nowadays they are increasingly more inclined to browse data and perform ad hoc analysis rather than deal with static reports. However, not being able to prepare or modify data set for analysis brings a lot of inconvenience and limitation for them. Finally, we have situation when those who prepare data -- don't analyze it, and those who analyze it -- can't prepare it. I believe this is a major factor that inhibits effectiveness of Business Intelligence in general.
Second, uber-popular Excel, which partially solves the problem of self-service data manipulation, is becoming more and more an obstacle rather than a solution because of two reasons:
a) Typical data volumes went beyond Excel capabilities and continue growing exponentially. Nowadays average analyzed data set is about 10-30mln of records and of 200-500GB size. That's too much for desktop Excel.
b) Spreadsheets as technology doesn't play well with relational data sources (e.g. adding a new value to a dimension can break all references in a spreadsheet; writing back from Excel to a database is a hassle). At the same time relational databases is the main source of data for BI tools and will remain it for decades.
Concept
In my opinion, any attempts to make traditional ETL/ELT more user friendly or stuff Excel with even more features will be ineffective. I believe data transformation needs to be re-thought and re-designed from scratch in order to make it appropriate for use by non-technical people.
Here is how I envision it:
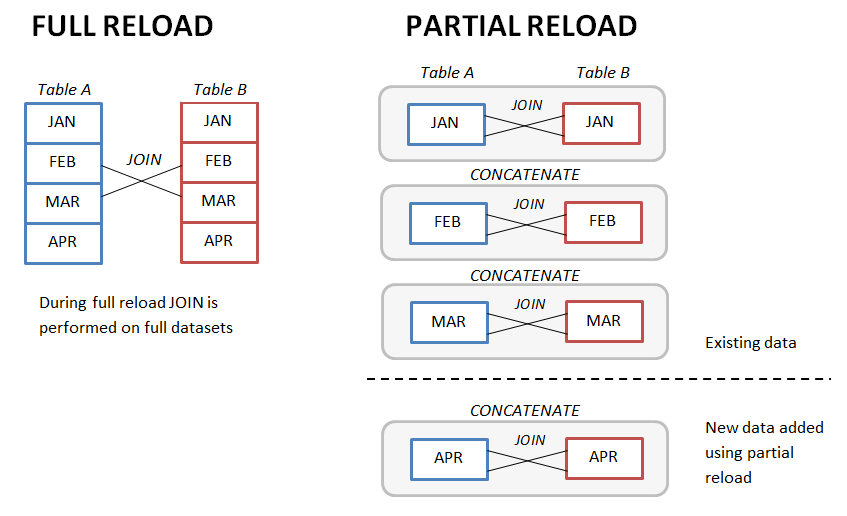
- It's visual. Who said you can't join two tables by dragging and dropping one on another? Left/right join? Not a problem. This can be done without knowing SQL at all. Another example -- grab a field header in a table, shake it with mouse to obtain a list of unique values of this field (which is actually a new table). Table concatenation, filtering, grouping -- all this can be done in a visual way.
- It's instant. What you see is what you get and get instantly. Result of manipulations and transformations is displayed immediately.
- It's table-based. Cell is just a particular case of a table. Vector either. Why don't treat them as tables? We don't really need a spreadsheet full of empty cells. It should be free-form layout consisting of connected tables (connection = transformation). Click on empty space to create a new cell and start editing it.
- It's functional/declarative. New columns and tables is result of functions applied to tables, fields or specific cell ranges. Transformation is actually a sequence of functions where resulting table of one function serves as input table for another. Business users understand concept of Excel-like functions, but don't understand SQL or imperative programming (and will never do).
- It's semantic. Name fields meaningfully. Fields with the same name expected to contain the same kind of information (e.g. Product Description). Refer by field names in functions and expressions (e.g. =Profit/Revenue). Make own re-usable functions.
- It's smart. Join by fields with the same names. Omit table name when referencing a field with unique name, etc.
Since business users very rarely operate with more than 50mlns of records the tool is not expected to have ultra-high performance or perform sophisticated transformations. Instead, main accent to be made on polished usability and simplicity of UI which would allow business users perform data manipulations themselves, without knowing SQL or asking data engineers for help. I believe this is achievable.
From technical standpoint -- this is in-memory data processing engine which is built either as WinForms .NET/C# application or web-application on any other stack (I've experience with .NET/C#, RoR, Javascript and now playing with Go). At some point JIT compilation of expressions will be required, so the stack should allow doing this.
Project
At this point the project is pure R&D which goal is to find out optimal product and UI concept, and build simple working prototype. There is no ready specification -- we will have to take a pen and a paper and think out, discuss and try various approaches until we find something we are strongly convinced about. There is a non-zero chance that this will never happen.
The result is working prototype that allows doing filtering, joins and concatenations and basic arithmetical operations on fields. Then there can be two options how it can evolve further -- either to build a commercial product and bootstrap as a side-project, or look for funding and turn into a company and then start building a commercial product.
Who I'm looking for
I'm looking for software development veterans who love Business Intelligence, understand its purpose and challenges, and are capable of resolving complex technical tasks which might involve extensive parallel calculations, concurrent execution and JIT compiling. Since my programming style is rather pedantic, DRY and, to some extent, perfectionist I'm looking for people with the same altitude and similar coding style. It should be mentioned that my main programming experience was 15 years ago and now I'm reinstating my coding skills with
QViewer and some web-projects. I expect you to be more experienced programmer than me, however that doesn't mean I'm expecting someone to do all the coding -- we do programming together and with equal efforts.
If this project looks interesting to you and you think you have appropriate experience of software development -- give me a shout and tell a few words about yourself. My email is in the upper right block of this blog. If you know someone who might be willing to take part in this project -- please don't hesitate to share with him/her the link to this blog post.
UPDATE (Feb 2015)
The concept described above has been made real as EasyMorph. See
http://easymorph.com for more details.