October 19, 2017

Tableau Maestro vs 3rd Party Data Prep Tools

If you haven't seen Tableau Maestro -- you should. I've seen the demo shown at the Tableau Conference 2017 and it's pretty cool (sorry, can't find a publicly available video). It's obvious that someone from the product management team has done a good job trying to address common challenges of data preparation (such as incorrect joins) in a visual way. Of course, Maestro is still in its infancy, but its introduction raises interesting questions. First of all, what does it mean for 3rd party data preparations tools, that target Tableau users?

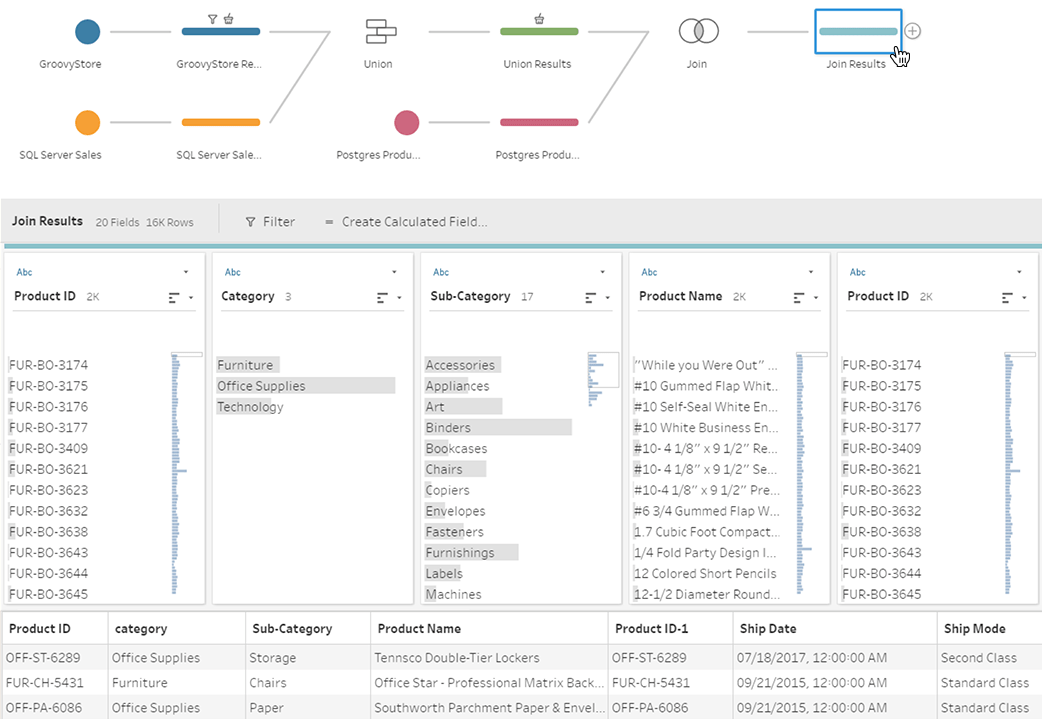
Tableau Maestro. This screenshot belongs to tableau.com

Before I go further let me classify the existing data transformation offerings:

Personal Data Preparation Tools
These are rather simple applications that allow performing basic operations such as cleansing, filtering, merging in a linear and non-parameterized way. While they're visual and target non-technical audience their applicability is usually pretty limited as they don't support non-linear workflows (a must have for anything non-trivial), have no means of automation and integration (e.g. running external applications) and have a limited set of available transforms. On the positive side, they're usually reasonably priced and easy to start with.

Departmental Data Transformation (ETL) Applications
Applications in this category are full-featured, rather capable ETL programs that allow designing non-linear workflows (that typically look like a block diagram where inputs and outputs of blocks are connected with arrows), integrate with external applications, and run parameterized tasks on schedule. They are way more capable than the personal data prep tool described above, while still remaining rather affordable. However the vast majority of them have one big flaw that renders them barely useful for Tableau audience -- they are too IT/DBA/SQL-centric and therefore simply not suitable for an average Tableau user. Unless s/he wants to dive into topics such as the nuances of differences between CHAR, VARCHAR and NVARCHAR data types on a daily basis (hint: it's not much fun).

EasyMorph, the data transformation tool I've designed and produced, technically also belongs to the Departmental ETL category. However unlike most ETL tools, it's designed from the ground up for non-technical users first of all, which required walking away from the traditional approach to ETL and re-thinking data transformation from scratch.

Enterprise ETL platforms
These are mastodons. In terms of features, scale, and of course, price. Big guns with a big price tag. Most of them are also heavily IT-centric, however some Enterprise ETL platforms (e.g. Alteryx and Lavastorm) have managed to become closer to non-technical users than the rest of the group. The exorbitant cost of licenses in this category severely restricts number of people that can use it for self-service data transformation within an organization. Especially, taking into account that in many cases they are used for departmental (and even personal) ETL, not enterprise, which is clearly overkill. After all, having 75-80% of revenue reinvested into sales and marketing allows hiring very skilled sales people :)

Now, where does Maestro fit in this classification? While it's still in beta, and no final product has been demonstrated yet I probably wouldn't be terribly off base if I assume that Maestro is a personal data preparation tool (probably with a non-linear workflow). Which means that Maestro, once released, would leave very little room for 3rd party software vendors in this category, especially if offered for free. Many will have simply to leave the market.

OK, what about EasyMorph then? I believe Maestro is a good thing for EasyMorph. While some our potential users might not realize at first that the two tools are in different categories, the introduction of Maestro actually makes EasyMorph a big favor:

1. It proves that good data analysis requires good data preparation. Tableau developers are incredibly creative people. It never ceases to amaze me what kinds of hacks and workarounds they use in Tableau in order to bring the source data into necessary shape. However, in many cases a decent non-linear data transformation tool would make this task straight forward, maintainable and debuggable.

2. It introduces the idea of a dedicated data transformation tool for wide audience. When pitching EasyMorph to various organizations I noticed that the idea of a specialized data transformation tool is not familiar to the non-technical audience. Developers understand the idea of a dedicated ETL tool and the benefits such a tool can provide. But business users (who comprise the biggest part of the Tableau user base) usually have hard times understanding the whole idea of visual data transformation. Maestro solves this task for us. With the power of Tableau's marketing :)

Someone said, that it's Apple and Steve Jobs who have taught smartphone users to buy apps and music instead of pirating it from somewhere. Apple's AppStore and iTunes have changed the mindset. I believe that Maestro will discover to many Tableau fans the convenience and power of visual self-service data preparation.

3. It makes it easier for us to explain to Tableau audience what EasyMorph is.  Now it's plain simple: "EasyMorph is Maestro on steroids". The more people will use Maestro, the more people will buy into the benefits and convenience of visual programming (yes, Ladies and Gentlemen, it's visual programming), so that EasyMorph would be a logical next step for Maestro users once the complexity of required calculations grows beyond trivial.

PS. It's interesting to see that the "data kitchen" concept that I wrote about almost 2 years ago has been materializing more and more.

September 17, 2017

Excel is incredibly successful application development platform


The more I think about Excel the more it looks to me as an application development platform, probably the most successful ever.

My first programming language was BASIC. Therefore the user interface of my first programs was basically a sequence of questions, which required typing in answers. PRINT this, INPUT that, IF/THEN, GOTO here. I started reading books on computer languages, learned Pascal, C++, ASM and eventually went to study Computer Science. A rather standard story of a software developer.

For many people far from software development their first programs looked radically different. They didn't even know they were programs. Because they were spreadsheets.

Modern Computer Science identifies 3 programming concepts:
  • Imperative (e.g. BASIC, C++, Python)
  • Functional (e.g. List, ML, Haskell, OCaml, F#)
  • Declarative (e.g. SQL, Prolog)
While there are heated debates among CS enthusiasts whether Excel falls into the declarative or functional programming concept, or it's a separate category on its own, most people never think of spreadsheets as of any kind of programming at all. But that didn't stop them from creating their first application without even knowing about it, because it was not a program in traditional sense, it's a spreadsheet. Millions of people develop applications and don't even realize it. Isn't it amazing?

If you think about it for a moment, a spreadsheet is a great way of creating applications. No need to deal with UI libraries, dialogs and forms -- just write in a cell what you need where you need it and you're done. You don't even have to bother with aligning objects -- everything is already aligned. A spreadsheet is visual and reactive -- whatever change you make, the result is immediately visible. It has only two abstractions: a cell, and a formula, and therefore is very easy to learn.

Yes, spreadsheet apps don't have the polished, productionalized look of "real" applications. But my first BASIC program didn't look that either. Yet it did its job. One can argue that spreadsheets are not suitable for general purpose programming. But neither is SQL, yet it's great for its purpose.

Spreadsheets allowed millions of people without programming skills create practical, useful applications that solve real life problems. If this is not amazing success for an application platform, then what is?

May 30, 2017

Understanding bar charts in QViewer listboxes

Starting from version 3 listboxes in QViewer have green bars beneath counts, like in the image below:


It may look as the bars are proportional to counts with 100% equal to the max count in the column. However, it's not the case. If you look closely at the screenshot above you can notice that values 02 and 08 have full bars (i.e. 100%) but their counts are not equal (2,236 and 2,922 respectively). More than that -- when no filter applied, all bars are at 100% regardless of the counts. OK, what do they mean then?

Each bar shows the selection ratio for each value and its value is calculated as count for current selection / total count of that particular value.

The best way to understand the bars is to think of them as of an inclusion indicator. They show the degree to which the current selection includes particular value: 0 means current selection doesn't include the value at all, while 100% means that current selection includes all rows with the value. That's why when no filters applied all bars are at 100%. For instance if dataset has field "Gender" with two possible values: "Male" and "Female", the bars would show to what degree the current selection includes males and females present in the dataset.

April 17, 2017

QViewer ver.3.3 is out

QViewer version 3.3 is now available for downloading. Here is what's new and exciting in the new version:

Support for QVD files larger than 2GB
Now you can open QVD files basically of any size. It was tested on QVD files up to 20GBs. Technically, at this point the only limitation is 2 billion rows per file. QViewer aggressively parallelize calculations so you may want to give it some time to perform necessary counts after opening a large file, because during that time CPU utilization can be near 100% which would make the application less responsive.

New Partial Load workflow
In the new version the workflow for partial load was significantly changed. The Partial Load button has been removed. Instead, when a file larger than certain threshold is opened QViewer suggests  performing a partial load (see the screenshot below). The threshold can be set at 512MB, 1GB, 2GB, 4GB or 8GB.


Indication of metrics affected by partial load
When a partial load is performed some metrics calculated by QViewer can be distorted because the loaded dataset is incomplete. To avoid confusion QViewer now shows which metrics are affected by partial load (shown red) and which are not.


Comments in generated script
When generating a LOAD statement, QViewer can now insert field comments obtained from the XML header. These comments are typically created using COMMENT FIELD or COMMENT TABLE statements in QlikView / Qlik Sense before exporting a table into QVD file.

Download QViewer

UPDATE 4/23/2017
I'm considering further improvements to QViewer. The ideas are floating around a few topics: table inspection for Qlik Sense Server, [shareable] selection bookmarks, support for other file formats (e.g. QVX, CSV, or XLSX), aggregation with built-in pivot tables (with selections applied). However, I'm not sure what would be the most useful for the Qlik dev community. I would appreciate hearing it from you -- what would you like to see in future versions of QViewer? Feel free to send me your suggestions (see my email in the upper right corner of this blog), or just leave a comment below.

April 9, 2017

Websites should offer downloading micromodels instead of CSV dumps

Many websites such as Google Analytics or PayPal allow users to download records (transactions) as CSV files or, sometimes, Excel spreadsheets. While it's more convenient than copy-pasting-parsing HTML from web-pages it's still not optimal because such dumps usually lack many details. For instance, when I download PayPal transactions I would also want to see product items, so that I could make a break down of sales by products. Or see customer addresses, so that I could analyze them from a geospatial perspective. Since the CSV dumps are denormalized, adding all the details and attributes would dramatically increase file sizes and also clutter them.

What I'm suggesting is that instead of CSV dumps websites should allow downloading micromodels -- user-related subsets of a bigger data model used by the web-service itself. Such micromodels would contain several linked normalized tables with only data relevant to the user who requested it. From a technical standpoint it can be one SQLite file generated on the fly. The SQLite file format allows packing multiple tables into one file which can hold millions of records.

Having a relational micromodel would allow more meaningful and interesting data analysis. It would play well with popular data analysis tools (except Excel which is poorly suited to work with relational data by design). Support for SQL queries would immediately make it compatible with vast amount of systems.

For information providers, an SQLite file with micromodel would be of size similar to current CSV dumps so it won't increase workload and traffic. Also generating micromodels can be even faster than generating CSV dumps since it won't require joining multiple tables in order obtain a denormalized view.

Below is an example of a possible micromodel schema for PayPal.

January 15, 2017

IT execs should not tell business users to choose between Tableau and Qlik

IT executives should not force business users to choose between Tableau and Qlik. After all, business users don't tell IT to choose between Windows and Linux.

Such "standardization", while still very popular in many organizations, brings more harm than good. It's originates from a few myths:


Myth #1: All BI tools are basically the same

This is no more true than saying "All airplanes are basically the same". Such altitude is coming from poor understanding of the purpose of Business Intelligence tools and capabilities of products available on the market. If two applications show charts and allow analyzing data it doesn't make them functionally equivalent because there is huge variety in the ways how data can be viewed and analyzed. Tell a good chef that all knives are basically the same therefore s/he should pick and use only one knife. Because, you know, "standardization".

BI tools are not the same. The task of data analysis and visualization is so complex and broad that no vendor can create a universal comprehensive solution, just like neither Boeing nor Airbus can create one universal airplane suitable for all cases -- from long passenger flights to air warfare to rescue operations.

For instance Qlik has amazing associative engine that allows easy discovery of logical relationships in data. Tableau has absolutely wonderful data visualization concept that unveils hidden patterns and provides meaningful perspectives that could be easily overlooked. Spotfire offers comprehensive means for scientific analysis and predictive modelling. The core concepts of these applications don't overlap. Some features surely do, but that doesn't make them interchangeable. Other BI tools also have their strong features. Any analytical application that has deeply thought-out, fundamental concept behind it will be significantly different from others.

Myth #2: Standardization is always a good thing

This myth is logically connected to Myth #1. Standardization, when it's applicable, has obvious benefits most of which boil down to one -- cost reduction. A company can get a deeper discount if it purchases more software licenses. You can save on training if you train employees only for 1 tool, instead of many. More people with similar skills are interchangeable, therefore less risk of losing critical expertise, also reduced staff count. And so on.

However, any cost reduction is only good when it doesn't degrade key functional capabilities. What would happen if you force a chef to "standardize" on knives? His/her functional capability would degrade. What would happen if you tell a military air force to use the same type of plane for cargo transportation and air dogfighting? Its functional capability would degrade. That's why nobody does it.

Myth #3: All business users have similar data analysis needs

There is a stereotypical understanding in the BI world that there are three main types of BI users: regular users (receive specialized reports), advanced users (interactively analyze and research data) and management users (look at dashboards, monitor high-level KPIs). It's an easy, simple and misleading classification. Misleading because BI adoption is never a one-way street. Unlike transactional systems, BI is still optional. It's hard to force people to use some tool if they don't like it or don't understand how to use it. In the case of BI adoption, they can always retreat to good old Excel (and they frequently do).

People are different and they have different preferences. When it comes to data analysis, two persons doing the same task might have different views on how to do it best. A good sign of a person who knows what s/he is doing is whether s/he has strong opinion on tools needed for the job. Therefore, business users themselves should pick what they need. If business users are okay with any analytical application given to them and have no own opinion on it then they don't really need it and purchasing it would be a waste of money.

Myth #4: Business users can do a good evaluation in a 2 month period


Data analysis is a rapidly developing discipline. It's developing in many directions: methods and techniques, visualizations, processing algorithms, metadata governance, unstructured data processing, etc. The times when a BI system was simply a visual SQL query generator with some interactive charting are long gone. BI is complex nowadays, and its complexity will only increase. Even best analytical applications on the market have rather steep learning curve, despite claims about the opposite in PR/marketing campaigns. Modern BI applications can be relatively easy to start with, but as soon as something slightly non-trivial is needed the learning curve skyrockets. Look at online forums like Tableau Community, or Qlik Community -- they are full of people asking tons of how-to questions which sometimes require rather lengthy and detailed answers.

I believe that a good understanding of capabilities of a data analysis application can be developed after at least 1 year of using the application regularly on complex real-life projects. That's in a case when there was no any previous experience with analytical applications. Or at least 6 months, if there was some (which means that you should be already familiar with some concepts). Asking business users without any previous experience with BI applications to provide a feedback on an application based on 2-3 month evaluation of some demo/PoC dashboard (i.e. which are not in production use) -- is a sure (albeit very common) way to get wrong conclusions. Don't do that.

OK, what's the alternative?

Tool as a Service (a.k.a. The Data Kitchen)

At this point you probably started suspecting that modern BI applications are not just more powerful than ever but also more complex than ever, and are more different from each other than ever. Comparing Tableau with Qlik makes as much sense as comparing apples with oranges. They are all round, after all, aren't they?

I believe that the most efficient way to adopt Business Intelligence is the one where adoption grows organically. IT departments should create an environment that fosters such organic growth, instead of limiting and restricting it for the purpose of hypothetical cost reduction. They should embrace the data kitchen concept, where multiple tools are available for the users who are looking for different ways to work with data. We can call it "Tool as a Service" if you will. Don't standardize on one BI system -- it's not going to work well. Ask business users what they like, and help them make it work from a technical perspective. It's the business users who should decide what to use and when. It's them who will accumulate the expertise of using the applications, not the IT people.

Practically, it means that teams as small as 5-10 people, or as big as 100 (or maybe even more) evaluate and test analytical applications themselves. The IT management should be ready that different teams may choose different applications. It's the users who should decide what works best for them. If they need two tools with somewhat overlapping features -- give them access to both. If more -- let them use as many as they need.

It doesn't mean that you will have to purchase every possible software for every user. Start with small packs of licenses for a few applications chosen by business users. Add more licenses when popularity of one of the applications increases. In this case license usage will correlate with growth of expertise. It's more efficient (also from a cost perspective) than spending millions for enterprise agreements then forcing everyone to use only the "standard" BI tool because "we spent so much money on it".