Showing posts with label Qlik Sense. Show all posts

January 27, 2018

Automation server for Qlik Sense

Qlik Sense is in many ways a more advanced platform than its predecessor, QlikView. Scalability, rich APIs, enterprise-level administration -- there are many features of a good architecture in it. However, what can be challenging for Qlik Sense customers (besides dealing with rudimentary data visualization) is automation. QlikView had embedded VBA scripting engine, which let designing automation scenarios initiated by users, but Qlik Sense doesn't have it. Disabled in the standard mode EXECUTE statement only aggravates the situation.

In this article, I'm proposing to extend Qlik Sense's capabilities with an automation server, based on EasyMorph Server. Such extension significantly simplifies a whole range of automation scenarios initiated by Qlik Sense user, that are difficult or non-trivial to implement otherwise. For instance:
  • Database writeback based on current selection in Qlik Sense.
  • One-click export of a subset of data from a Qlik Sense app into an external system or a disk folder.
  • Sending personalized emails with attached customized data extracts from Qlik Sense.
  • Downloading a particular file from a web-site and dynamically adding its content to a Qlik Sense app.
  • Automated data quality checks of incoming source data with rule-based email notifications.
The integration mechanism between Qlik Sense and EasyMorph Server is based on REST API and Websockets (see the diagram below):

Click to zoom

Actions are initiated by a Qlik Sense user by clicking a dynamically generated hyperlink, or an extension button. This triggers an EasyMorph Server task which runs an EasyMorph project with specified parameters (passed through the hyperlink or extension). The project performs required actions with external files and systems. Finally, the task status is reported back into the Qlik Sense app that initiated it. Alternatively, the task initiates a full or partial reload of the app using the REST API. 

A few benefits of such integration scheme:
  • In one Qlik Sense application there can be multiple action buttons that initiate different actions.
  • It works well with tiered Qlik Sense apps, where one app is for ETL, another for building a data model, and another one for the UI objects.
  • Closed loop feedback: task status and result are reported back to the user. If the task fails the errors will be reported to the user as well.
  • Task parameters can be assigned dynamically using Qlik Sense variables and expressions.
  • The action server can be hosted on a different machine thus reducing exposure of the Qlik Sense sever.
At this point we're half-way to implementing the integration scheme described above. This means that some of its elements are already in place, while other are in active development and will be released soon. As of version 3.7.1 already available:
The tool set described above is already suitable for adding automation capabilities to Qlik Sense apps. For instance database writebacks, extract generation or email sendouts are already possible by using dynamic hyperlinks in Qlik Sense applications. For better user experience and more advanced automation capabilities, a few more features are being developed and planned for release in version 3.8:
  • An interactive Qlik Sense app extension for triggering EM Server tasks and monitoring task status and errors in real-time.
  • The Qlik Sense Command transformation for triggering reloading Qlik Sense apps and QMC tasks right from EasyMorph projects.
  • Fetching emails and processing attachments.
With the addition of these features, the full integration scenario described in this article becomes possible. Besides that, EasyMorph will be able to work as a visual data transformation tool for Qlik Sense:

Click to zoom
In this case, a user triggers (through a link or extension) an EasyMorph task that generates QVD files (one file per one table in data model) and initiates reloading of the Qlik Sense app that called it. The app loads the generated QVDs.

If you would like to talk about about automation for Qlik Sense, send me an email (you can find my address in the upper right area of this blog or here).

To receive future updates on EasyMorph and its integrations with Qlik and other systems, subscribe to our newsletter on the download page.

November 15, 2016

Now we know where Tableau is heading. Where is Qlik going?

During the recent conference Tableau has unveiled its three-year roadmap. Briefly, it includes:
  • High-performance in-memory engine based on Hyper (in the timeframe that I predicted earlier)
  • Enhanced data preparation capabilities (Project Maestro)
  • Built-in data governance
  • Pro-active automatically designed visualizations
  • Tableau Server for Linux
The most interesting are the first two. Once implemented, they will significantly reduce the gap with Qlik in terms of performance and versatility. I wouldn't expect the first version of Tabeau's in-memory engine to be as performant and scalable as Qlik's QIX (let's not dismiss almost 20 years of tuning and optimizations), however I would predict that for small and medium deployments performance will not be an issue. Even if we assume that QIX would still be 2-3 times faster than Tableau Hyper -- performance won't be a decision-critical factor anymore.

Project Maestro is another inevitable move from Tableau people who now realize that self-service data analysis requires self-service data transformation. Tableau is still reluctant building a fully-featured ETL for business users like EasyMorph, however once Project Maestro is implemented the advantage of having built-in ETL capabilities in Qlik would be diminished (but not dismissed).

Now, when Tableau has clear advantage on the data visualization side and stops being a fancy add-on to databases but becomes more and more a self-contained analytical platform, the question is -- where is Qlik going?

QlikView is not actively developed anymore. All the recent developments on the Qlik Sense side in 90% cases are focused on expanding API capabilities, while its data visualization capabilities remain frugal. Honestly, I don't understand this development logic. I would understand it, if Qlik's product strategy assumed heavy reliance on 3rd party tools for decent data visualization and analysis. However so far I struggle to see any high-quality 3rd party tools built on top of Qlik Sense API that can amend the built-in visualizations. Qlik Market might have a few interesting extensions, but they're typically very specialized. Qlik Branch lacks high-quality extensions and is full of no longer supported experimental projects. Qlik itself doesn't promote any 3rd party tools and its product roadmap is yet to be seen.

So where is Qlik going?

September 4, 2016

How to use the memstat metrics in QViewer

Starting from version 3.1 QViewer shows two memstat metrics in Table Metadata window:
  • Size, bytes -- total size of the column in bytes
  • Avg.bytes per symbol -- average size of column values in byte 


click to zoom


These metrics are calculated similarly to memstat data available in QlikView (not available in Qlik Sense so far). Since the structure of QVD files is very close to the internal in-memory data format in Qlik these metrics can be used to optimize (reduce) memory footprint of resident tables which can be desirable for particularly large applications. The most convenient way to inspect resident tables in QViewer is setup a simple generic subroutine as described here. Alternatively, you can insert temporary STORE statements to save resident tables into QVDs and then open them in QViewer manually.

When looking at the memstat metrics in QViewer you would typically want to identify columns that take most of space (hint: click column headers in Table Metadata to sort the grid). A few things that you can do reduce table size:
  • Remove unnecessary columns that take a lot of space
  • Force Qlik to convert duals to numbers by multiplying them by 1
  • Trim text values to remove trailing and leading spaces
  • Use integers instead of floats where possible
  • Round up floats to fewer decimal digits to have fewer distinct values in the column
  • Use autonumbers instead of long composite text keys
Read also "A few tips for dealing with large QlikView applications".

Remarks
Qlik uses special format for columns with incrementally increasing integers (autonumbers) -- they basically don't  take up any space in memory, although QVDs store them as regular columns.

The memstat metrics are calculated correctly even if QVDs are partially loaded in QViewer. Therefore you can use them in the free version of QViewer, or when partial loading was used.

QVDs generated in Qlik Sense v.2 and above are compatible with QVDs generated in QlikView and therefore can be opened in QViewer as well.

The total size is NOT simply the avg. symbol size multiplied by # of rows -- it's calculated using a more complicated logic that accounts data compression.

May 1, 2016

Why I prototype Qlik apps in EasyMorph before creating them

If you want to create a Qlik app just create it, why would anyone build a prototype in another tool first? Isn't it just a waste of time? For simple cases -- probably yes, but for complex apps prototyping them first allows designing apps faster and more reliably. Here is why:

When developing Qlik apps with a complex transformation logic one of the main challenges is to deal with data quality and data structure of poorly documented source systems. Therefore the most time-consuming phase is figuring out how to process data correctly and what can potentially go wrong. There are many questions to answer during this phase, for instance:
  • How do we merge data -- what are the link fields, what fields are appended? 
  • Does any combination of the link fields have duplicates in one or the other table? 
  • Do the link fields have nulls?
  • Are nulls actually nulls or empty text strings?
  • Are numbers actually numbers, not text?
  • Do text values have trailing spaces?
  • After we join tables, does the result pass a sanity check?
  • How can we detect it if the join goes wrong on another set of data (e.g. for another time period)?
  • Are dates and amounts within expected ranges?
  • Do dimensions have complete set of values, is anything missing?
  • When dealing with data in spreadsheets
    • Are text and numbers mixed in the same column? If yes, what is the rule to clean things up?
    • Are column names and their positions consistent across spreadsheets? If not, how do we handle the inconsistency?
    • Are sheet names consistent across spreadsheets?
These are kinds of questions you would want to have answered before believing that a transformation works correctly and reliably. Unfortunately, scripting in Qlik, like any other scripting, is poorly suitable for interactive data profiling. And that's where you start wasting your time. To answer questions like those above in Qlik you would need to modify and re-run script many times and every time Qlik will reload same data again and again. Even if it's a small test dataset in a QVD, it still takes time, or you risk profiling too little data. Oh, and if you mistakenly omitted a comma your app is dropped and you need to re-open it and re-run again. Then after each reload you would have to create some one-off layout objects and write some one-off expressions, just to get one question answered. Tricks like inspecting resident tables make life a bit easier, but just a bit. Overall, it's an inconvenient and cumbersome process. It effectively discourages data exploration, which sooner or later leads to errors that are discovered on late stages, where the cost of redesigning and fixing errors is much higher than on earlier stages.

This is where EasyMorph comes in handy. First, it loads data once, then keeps it in memory, therefore, it doesn't have to be reloaded every time. And if you load sample data only one time, why not use a bigger data set which is usually better for data profiling? Not only does EasyMorph load data only once, it also keeps in memory results of all successful transformations. So if an error occurs, you continue from where it stopped, not from the beginning -- another time-saving feature.

Second, EasyMorph runs transformations automatically in the background after any change. It's like if you are writing a Qlik script, and while you're writing it after any change or new statement Qlik runs the script proactively, without requiring you to press Reload. Except Qlik doesn't do it. Basically, transformations to EasyMorph is what formulas are to Excel -- you change one and immediately see a new result of calculations, regardless of how many formulas/transformations it took.

Third, designing a transformation process visually is much faster than scripting. Some Qlik developers are exceptionally good at writing scripts, but even they can't beat it when a whole transformation like aggregation is created literally in two clicks. If one knew exactly from the beginning what a script should do then writing it quickly would not be a problem. It's the numerous iterative edits, corrections and reloads that make writing Qlik scripts long. Once I have designed and debugged a transformation logic in EasyMorph, scripting it in Qlik is usually a matter of couple hours, and it typically works reliably and as expected from the 1st run.

Another important advantage of prototyping Qlik apps in EasyMorph is that it allows creating a reference result. When you design a Qlik application off an existing Excel or BI report it usually makes the task easier because numbers in the old report serve as a reference you can compare against. However, if you design a brand new report there might be no reference at all. How can you be sure that your Qlik script, expressions and sets work correctly? There is a whole lot of things that can go wrong. Building a prototype in EasyMorph gives you that reference point and not just for the script, but also for expressions, including set analysis. In airplanes, measuring crucial indicators like altitude and velocity must be done using at least two probes (for each metric) that utilize different principles of physics so that pilots can be sure it's measured correctly. The same principle here -- "get another reference point".

I also found that designing apps in close cooperation with business users is more productive when the users have good understanding of how a transformation logic works. It's better explained by letting them explore a visual process in EasyMorph rather than showing totally cryptic (for them) Qlik scripts.

Resume: EasyMorph is a professional tool which can be used by QlikView / Qlik Sense developers to create robust and reliable applications faster by prototyping them first. I do it myself, and so far it works pretty well.

March 11, 2016

Thoughts on Tableau acquiring HyPer

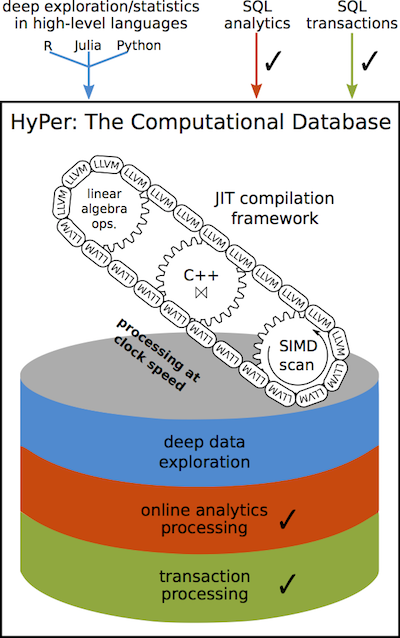
As it became known [1][2] today Tableau acquires HyPer  -- a small German database company that created a high-speed in-memory hybrid OLTP/OLAP database engine. HyPer was founded by two university professors and has ten PhD students and alumni on board, four of which will be joining Tableau.


HyPer claims to have high performance in both transactional and analytical types of workloads, achievable even on ARM architectures. It uses many smart techniques like virtual memory snapshoting to run long and short queries on the same datasets, one-the-fly compilation of queries into low-level code, adaptive indexing, hot clustering for query parallelization and many others (see  HyPer overview).

Does it mean that Tableau becomes a database company? Apparently no. First, because that's not what they do, and second, because HyPer is rather an academic technology research rather than a market-ready product.

To me this acquisition is very much like Qlik's acquisition of NComVa a few years ago. Let me explain it a bit:

NComVa was a small company that built interactive Javascript data visualizations. From what I understand Qlik Sense to some extent exploits the expertise acquired from NComVa. Qlik is very good at engineering highly optimized data engines, but academic data visualization and user experience is hardly can be counted as their core competence (I'll write a separate post on it). So Qlik needed some "brain injection" that led to birth of Qlik Sense.

With Tableau the situation is opposite -- their competence in data visualization and usability is outstanding, however high-performance in-memory data processing has never been a strong point in Tableau's agenda -- the idea was to piggyback existing relational DBMSes. To remind you, Tableau only recently switched to a 64-bit architecture and introduced multi-threaded query execution for their in-memory engine.

Therefore, the acquisition of HyPer is a long needed "brain injection" of top-notch data processing expertise. And it may change things significantly for Tableau customers, competitors and Tableau themselves.

I would suggest that in 1-2 years (not earlier) Tableau will introduce something like a super-cache -- the ability to hold big amounts of data (up to 1 TB or more) in memory, query it instantly with sub-second response times, and update in real-time.

Interesting questions are: whether it will require data modelling, how data will be loaded, and whether it will scale horizontally. The latter question is the most interesting, because Qlik, the closest Tableau's competitor, doesn't scale horizontally meaning that a single dataset can't be split across several nodes that are queried in parallel. HyPer hints at distributed data processing, so it could be possible that the "super-cache" will scale horizontally, which can be a big deal.

All in all, the acquisition is an intriguing twist of story. It will be interesting to see how it unfolds.

[1] http://www.tableau.com/about/press-releases/2016/tableau-acquires-hyper
[2] http://www.tableau.com/about/blog/2016/3/welcome-hyper-team-tableau-community-51375