Showing posts with label Tableau. Show all posts

October 19, 2017

Tableau Maestro vs 3rd Party Data Prep Tools

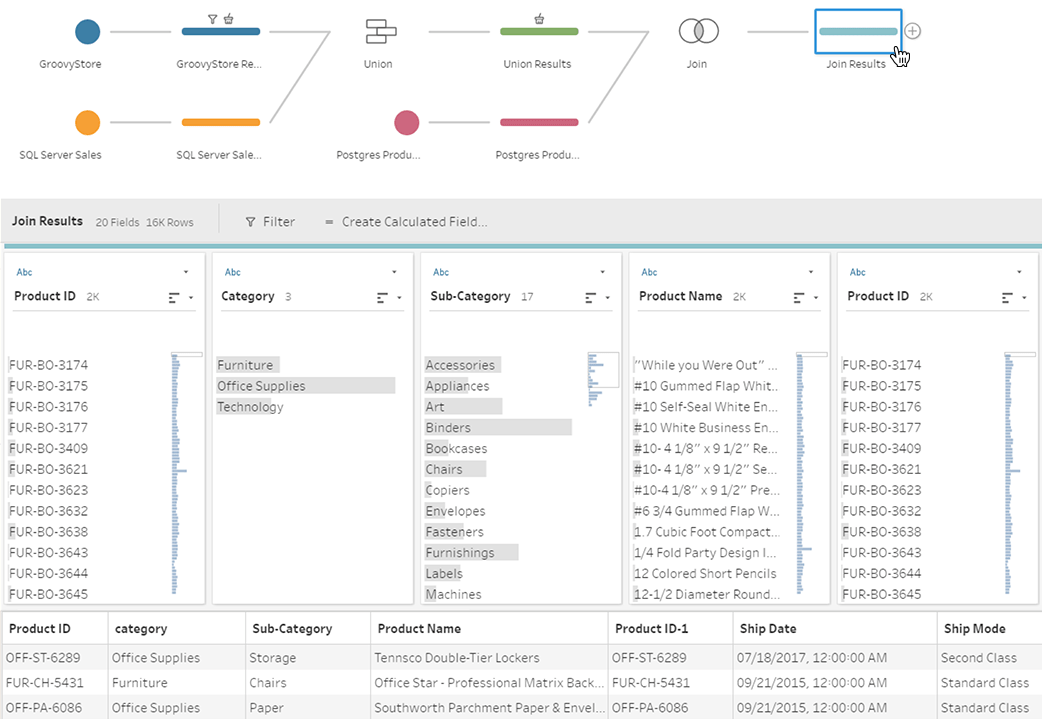
If you haven't seen Tableau Maestro -- you should. I've seen the demo shown at the Tableau Conference 2017 and it's pretty cool (sorry, can't find a publicly available video). It's obvious that someone from the product management team has done a good job trying to address common challenges of data preparation (such as incorrect joins) in a visual way. Of course, Maestro is still in its infancy, but its introduction raises interesting questions. First of all, what does it mean for 3rd party data preparations tools, that target Tableau users?

Tableau Maestro. This screenshot belongs to tableau.com

Before I go further let me classify the existing data transformation offerings:

Personal Data Preparation Tools
These are rather simple applications that allow performing basic operations such as cleansing, filtering, merging in a linear and non-parameterized way. While they're visual and target non-technical audience their applicability is usually pretty limited as they don't support non-linear workflows (a must have for anything non-trivial), have no means of automation and integration (e.g. running external applications) and have a limited set of available transforms. On the positive side, they're usually reasonably priced and easy to start with.

Departmental Data Transformation (ETL) Applications
Applications in this category are full-featured, rather capable ETL programs that allow designing non-linear workflows (that typically look like a block diagram where inputs and outputs of blocks are connected with arrows), integrate with external applications, and run parameterized tasks on schedule. They are way more capable than the personal data prep tool described above, while still remaining rather affordable. However the vast majority of them have one big flaw that renders them barely useful for Tableau audience -- they are too IT/DBA/SQL-centric and therefore simply not suitable for an average Tableau user. Unless s/he wants to dive into topics such as the nuances of differences between CHAR, VARCHAR and NVARCHAR data types on a daily basis (hint: it's not much fun).

EasyMorph, the data transformation tool I've designed and produced, technically also belongs to the Departmental ETL category. However unlike most ETL tools, it's designed from the ground up for non-technical users first of all, which required walking away from the traditional approach to ETL and re-thinking data transformation from scratch.

Enterprise ETL platforms
These are mastodons. In terms of features, scale, and of course, price. Big guns with a big price tag. Most of them are also heavily IT-centric, however some Enterprise ETL platforms (e.g. Alteryx and Lavastorm) have managed to become closer to non-technical users than the rest of the group. The exorbitant cost of licenses in this category severely restricts number of people that can use it for self-service data transformation within an organization. Especially, taking into account that in many cases they are used for departmental (and even personal) ETL, not enterprise, which is clearly overkill. After all, having 75-80% of revenue reinvested into sales and marketing allows hiring very skilled sales people :)

Now, where does Maestro fit in this classification? While it's still in beta, and no final product has been demonstrated yet I probably wouldn't be terribly off base if I assume that Maestro is a personal data preparation tool (probably with a non-linear workflow). Which means that Maestro, once released, would leave very little room for 3rd party software vendors in this category, especially if offered for free. Many will have simply to leave the market.

OK, what about EasyMorph then? I believe Maestro is a good thing for EasyMorph. While some our potential users might not realize at first that the two tools are in different categories, the introduction of Maestro actually makes EasyMorph a big favor:

1. It proves that good data analysis requires good data preparation. Tableau developers are incredibly creative people. It never ceases to amaze me what kinds of hacks and workarounds they use in Tableau in order to bring the source data into necessary shape. However, in many cases a decent non-linear data transformation tool would make this task straight forward, maintainable and debuggable.

2. It introduces the idea of a dedicated data transformation tool for wide audience. When pitching EasyMorph to various organizations I noticed that the idea of a specialized data transformation tool is not familiar to the non-technical audience. Developers understand the idea of a dedicated ETL tool and the benefits such a tool can provide. But business users (who comprise the biggest part of the Tableau user base) usually have hard times understanding the whole idea of visual data transformation. Maestro solves this task for us. With the power of Tableau's marketing :)

Someone said, that it's Apple and Steve Jobs who have taught smartphone users to buy apps and music instead of pirating it from somewhere. Apple's AppStore and iTunes have changed the mindset. I believe that Maestro will discover to many Tableau fans the convenience and power of visual self-service data preparation.

3. It makes it easier for us to explain to Tableau audience what EasyMorph is.  Now it's plain simple: "EasyMorph is Maestro on steroids". The more people will use Maestro, the more people will buy into the benefits and convenience of visual programming (yes, Ladies and Gentlemen, it's visual programming), so that EasyMorph would be a logical next step for Maestro users once the complexity of required calculations grows beyond trivial.

PS. It's interesting to see that the "data kitchen" concept that I wrote about almost 2 years ago has been materializing more and more.

January 15, 2017

IT execs should not tell business users to choose between Tableau and Qlik

IT executives should not force business users to choose between Tableau and Qlik. After all, business users don't tell IT to choose between Windows and Linux.

Such "standardization", while still very popular in many organizations, brings more harm than good. It's originates from a few myths:


Myth #1: All BI tools are basically the same

This is no more true than saying "All airplanes are basically the same". Such altitude is coming from poor understanding of the purpose of Business Intelligence tools and capabilities of products available on the market. If two applications show charts and allow analyzing data it doesn't make them functionally equivalent because there is huge variety in the ways how data can be viewed and analyzed. Tell a good chef that all knives are basically the same therefore s/he should pick and use only one knife. Because, you know, "standardization".

BI tools are not the same. The task of data analysis and visualization is so complex and broad that no vendor can create a universal comprehensive solution, just like neither Boeing nor Airbus can create one universal airplane suitable for all cases -- from long passenger flights to air warfare to rescue operations.

For instance Qlik has amazing associative engine that allows easy discovery of logical relationships in data. Tableau has absolutely wonderful data visualization concept that unveils hidden patterns and provides meaningful perspectives that could be easily overlooked. Spotfire offers comprehensive means for scientific analysis and predictive modelling. The core concepts of these applications don't overlap. Some features surely do, but that doesn't make them interchangeable. Other BI tools also have their strong features. Any analytical application that has deeply thought-out, fundamental concept behind it will be significantly different from others.

Myth #2: Standardization is always a good thing

This myth is logically connected to Myth #1. Standardization, when it's applicable, has obvious benefits most of which boil down to one -- cost reduction. A company can get a deeper discount if it purchases more software licenses. You can save on training if you train employees only for 1 tool, instead of many. More people with similar skills are interchangeable, therefore less risk of losing critical expertise, also reduced staff count. And so on.

However, any cost reduction is only good when it doesn't degrade key functional capabilities. What would happen if you force a chef to "standardize" on knives? His/her functional capability would degrade. What would happen if you tell a military air force to use the same type of plane for cargo transportation and air dogfighting? Its functional capability would degrade. That's why nobody does it.

Myth #3: All business users have similar data analysis needs

There is a stereotypical understanding in the BI world that there are three main types of BI users: regular users (receive specialized reports), advanced users (interactively analyze and research data) and management users (look at dashboards, monitor high-level KPIs). It's an easy, simple and misleading classification. Misleading because BI adoption is never a one-way street. Unlike transactional systems, BI is still optional. It's hard to force people to use some tool if they don't like it or don't understand how to use it. In the case of BI adoption, they can always retreat to good old Excel (and they frequently do).

People are different and they have different preferences. When it comes to data analysis, two persons doing the same task might have different views on how to do it best. A good sign of a person who knows what s/he is doing is whether s/he has strong opinion on tools needed for the job. Therefore, business users themselves should pick what they need. If business users are okay with any analytical application given to them and have no own opinion on it then they don't really need it and purchasing it would be a waste of money.

Myth #4: Business users can do a good evaluation in a 2 month period


Data analysis is a rapidly developing discipline. It's developing in many directions: methods and techniques, visualizations, processing algorithms, metadata governance, unstructured data processing, etc. The times when a BI system was simply a visual SQL query generator with some interactive charting are long gone. BI is complex nowadays, and its complexity will only increase. Even best analytical applications on the market have rather steep learning curve, despite claims about the opposite in PR/marketing campaigns. Modern BI applications can be relatively easy to start with, but as soon as something slightly non-trivial is needed the learning curve skyrockets. Look at online forums like Tableau Community, or Qlik Community -- they are full of people asking tons of how-to questions which sometimes require rather lengthy and detailed answers.

I believe that a good understanding of capabilities of a data analysis application can be developed after at least 1 year of using the application regularly on complex real-life projects. That's in a case when there was no any previous experience with analytical applications. Or at least 6 months, if there was some (which means that you should be already familiar with some concepts). Asking business users without any previous experience with BI applications to provide a feedback on an application based on 2-3 month evaluation of some demo/PoC dashboard (i.e. which are not in production use) -- is a sure (albeit very common) way to get wrong conclusions. Don't do that.

OK, what's the alternative?

Tool as a Service (a.k.a. The Data Kitchen)

At this point you probably started suspecting that modern BI applications are not just more powerful than ever but also more complex than ever, and are more different from each other than ever. Comparing Tableau with Qlik makes as much sense as comparing apples with oranges. They are all round, after all, aren't they?

I believe that the most efficient way to adopt Business Intelligence is the one where adoption grows organically. IT departments should create an environment that fosters such organic growth, instead of limiting and restricting it for the purpose of hypothetical cost reduction. They should embrace the data kitchen concept, where multiple tools are available for the users who are looking for different ways to work with data. We can call it "Tool as a Service" if you will. Don't standardize on one BI system -- it's not going to work well. Ask business users what they like, and help them make it work from a technical perspective. It's the business users who should decide what to use and when. It's them who will accumulate the expertise of using the applications, not the IT people.

Practically, it means that teams as small as 5-10 people, or as big as 100 (or maybe even more) evaluate and test analytical applications themselves. The IT management should be ready that different teams may choose different applications. It's the users who should decide what works best for them. If they need two tools with somewhat overlapping features -- give them access to both. If more -- let them use as many as they need.

It doesn't mean that you will have to purchase every possible software for every user. Start with small packs of licenses for a few applications chosen by business users. Add more licenses when popularity of one of the applications increases. In this case license usage will correlate with growth of expertise. It's more efficient (also from a cost perspective) than spending millions for enterprise agreements then forcing everyone to use only the "standard" BI tool because "we spent so much money on it".

November 15, 2016

Now we know where Tableau is heading. Where is Qlik going?

During the recent conference Tableau has unveiled its three-year roadmap. Briefly, it includes:
  • High-performance in-memory engine based on Hyper (in the timeframe that I predicted earlier)
  • Enhanced data preparation capabilities (Project Maestro)
  • Built-in data governance
  • Pro-active automatically designed visualizations
  • Tableau Server for Linux
The most interesting are the first two. Once implemented, they will significantly reduce the gap with Qlik in terms of performance and versatility. I wouldn't expect the first version of Tabeau's in-memory engine to be as performant and scalable as Qlik's QIX (let's not dismiss almost 20 years of tuning and optimizations), however I would predict that for small and medium deployments performance will not be an issue. Even if we assume that QIX would still be 2-3 times faster than Tableau Hyper -- performance won't be a decision-critical factor anymore.

Project Maestro is another inevitable move from Tableau people who now realize that self-service data analysis requires self-service data transformation. Tableau is still reluctant building a fully-featured ETL for business users like EasyMorph, however once Project Maestro is implemented the advantage of having built-in ETL capabilities in Qlik would be diminished (but not dismissed).

Now, when Tableau has clear advantage on the data visualization side and stops being a fancy add-on to databases but becomes more and more a self-contained analytical platform, the question is -- where is Qlik going?

QlikView is not actively developed anymore. All the recent developments on the Qlik Sense side in 90% cases are focused on expanding API capabilities, while its data visualization capabilities remain frugal. Honestly, I don't understand this development logic. I would understand it, if Qlik's product strategy assumed heavy reliance on 3rd party tools for decent data visualization and analysis. However so far I struggle to see any high-quality 3rd party tools built on top of Qlik Sense API that can amend the built-in visualizations. Qlik Market might have a few interesting extensions, but they're typically very specialized. Qlik Branch lacks high-quality extensions and is full of no longer supported experimental projects. Qlik itself doesn't promote any 3rd party tools and its product roadmap is yet to be seen.

So where is Qlik going?

March 11, 2016

Thoughts on Tableau acquiring HyPer

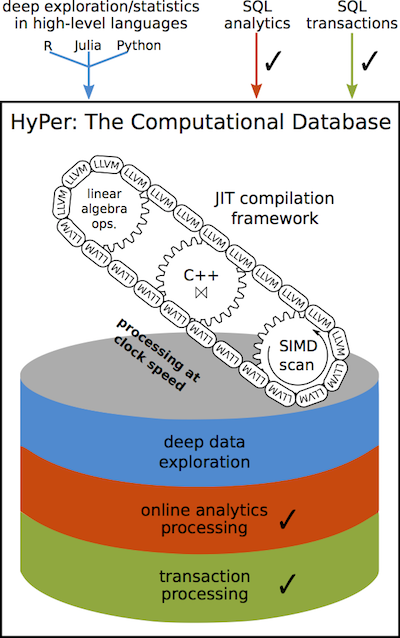
As it became known [1][2] today Tableau acquires HyPer  -- a small German database company that created a high-speed in-memory hybrid OLTP/OLAP database engine. HyPer was founded by two university professors and has ten PhD students and alumni on board, four of which will be joining Tableau.


HyPer claims to have high performance in both transactional and analytical types of workloads, achievable even on ARM architectures. It uses many smart techniques like virtual memory snapshoting to run long and short queries on the same datasets, one-the-fly compilation of queries into low-level code, adaptive indexing, hot clustering for query parallelization and many others (see  HyPer overview).

Does it mean that Tableau becomes a database company? Apparently no. First, because that's not what they do, and second, because HyPer is rather an academic technology research rather than a market-ready product.

To me this acquisition is very much like Qlik's acquisition of NComVa a few years ago. Let me explain it a bit:

NComVa was a small company that built interactive Javascript data visualizations. From what I understand Qlik Sense to some extent exploits the expertise acquired from NComVa. Qlik is very good at engineering highly optimized data engines, but academic data visualization and user experience is hardly can be counted as their core competence (I'll write a separate post on it). So Qlik needed some "brain injection" that led to birth of Qlik Sense.

With Tableau the situation is opposite -- their competence in data visualization and usability is outstanding, however high-performance in-memory data processing has never been a strong point in Tableau's agenda -- the idea was to piggyback existing relational DBMSes. To remind you, Tableau only recently switched to a 64-bit architecture and introduced multi-threaded query execution for their in-memory engine.

Therefore, the acquisition of HyPer is a long needed "brain injection" of top-notch data processing expertise. And it may change things significantly for Tableau customers, competitors and Tableau themselves.

I would suggest that in 1-2 years (not earlier) Tableau will introduce something like a super-cache -- the ability to hold big amounts of data (up to 1 TB or more) in memory, query it instantly with sub-second response times, and update in real-time.

Interesting questions are: whether it will require data modelling, how data will be loaded, and whether it will scale horizontally. The latter question is the most interesting, because Qlik, the closest Tableau's competitor, doesn't scale horizontally meaning that a single dataset can't be split across several nodes that are queried in parallel. HyPer hints at distributed data processing, so it could be possible that the "super-cache" will scale horizontally, which can be a big deal.

All in all, the acquisition is an intriguing twist of story. It will be interesting to see how it unfolds.

[1] http://www.tableau.com/about/press-releases/2016/tableau-acquires-hyper
[2] http://www.tableau.com/about/blog/2016/3/welcome-hyper-team-tableau-community-51375

March 3, 2016

Are BI/ETL vendors ready for "data kitchens"? Because users are

If you've been in the BI/ETL industry for several years you may remember that many years ago BI/ETL vendors actively promoted the concept of so called "BI standardization". Gartner, Forrester and other market analysts also talked about it -- organizations should stop having "zoo parks of systems" and standardize on one platform. At that time even the big BI vendors were only transitioning from a single-tool client-server architecture to a multiple-tool web-based one and many hoped that once they complete the transition organizations would be able to cover their data analysis needs with a comprehensive product set (platform) from one vendor. These expectations were driven by high cost and complexity of the analytical systems at that time, so standardizing on one platform would facilitate building in-house expertise, lower maintenance costs, and simplify support and administration.

However, the reality turned out to be more complex. As a matter of fact it became clear that no vendor can offer really comprehensive product suite that would satisfy data analysis hunger of various types of users. The more users became involved into data analysis the more diverse and sophisticated needs they developed.

It seems to me that organizations are increasingly becoming ready to embrace the concept of "data kitchen" where users have a choice from many tools so that they can choose whether to use a "spoon", "fork", or "knife" for a job, rather than having just a "spoon" for all cases. However, the problem is that the vendors are not ready -- they still want customers to buy their expensive cumbersome enterprise platforms.

So what would be the difference between a "data kitchen tool" and an "old-school tool":

Click to zoom
I guess the table above is self-explanatory. I would only make a couple notes:

Usability was long ignored but now it's the king. First, because data analysis is difficult, therefore I believe that software vendors should go the extra mile to design well thought out, clean and polished UI. Enterprise software should be smarter and simpler, even at a cost of removing some functionality (look at some popular mobile apps). Second, when you have many tools in your "kitchen" you can't afford spending a lot of time figuring out how to use each of them. A single tool may not require too much attention. Selfish ones don't survive in a team. Hence the necessity of open data formats and APIs. Open metadata is required for throughout data governance -- a must-have for a "data kitchen".

Another note is about price. Cost structure per user will change. If previously an organization could spend $5,000 for one license for one user, one should not expect that because of the "data kitchen" organizations will start buying 10 tools for the same $5K each spending in total $50K per user. Instead they will be looking to offer a user 10 tools for $500 each. I believe those software vendors that resist the change and keep prices high will be eventually squeezed out of the market.

You can check your favorite software against the table above. Some products are better suited to find a place in a "data kitchen", some are not. In my opinion Tableau is a good example of well thought out and polished user experience aimed for self-service use. I wish only they opened TDE and/or adopted some open format for data exchange. I hope EasyMorph can become another good example of a tool that is perfectly suitable for the "data kitchen" concept. We're living in an interesting time after all -- the BI/ETL market stagnated for long time, but now the pendulum has swung in the opposite direction and we can observe many interesting products coming to the market.

Isn't it great?

September 20, 2015

The Data Warehouse Myth

We all know the concept of data warehousing: take data from various sources, cleanse it, transform it, load it into a relational database, make it uniform and accessible by SQL-based BI-tools in order to create a single, holistic view of an organization's performance. Thousands of projects teams try to build this every year. Thousands of consulting companies offer this service. I've been doing this for more than 12 years.

Now I realize it's a myth.

It's never possible to bring everything needed into a data warehouse. If your business is not big, you probably can bring together 90% of your data. Some 10% will always remain somewhere outside. There are many reasons why important data stays outside: it could simply not exist when you started building your data warehouse, or business requirements changed while you were building it, or one of your source systems got replaced with another one, or a new business line opened, and so on. This makes data warehouses expensive never-ending projects that never reach their goal of becoming a single, holistic data source. If your organization is large, your data warehouse might even not cover 40% of your organization data analysis needs.

Having expensive long-term projects that never reach their goals isn't very reasonable, is it? But why is this happening?

First, the assumption that "if it works for some our data then it should work for all our data" turns out to be wrong. Indeed, once you've successfully built a small analytical database that covers some of company's business (which is totally doable) it's very tempting to start thinking "now let's buy a bigger server and put everything into this thing". But what works locally doesn't always work globally. A data warehouse is a tightly coupled system. The more you try to extend tight connections, the more effort and money required for it, and it grows exponentially. At some point it's not reasonable anymore to keep everything in a tightly coupled system. This happens earlier than many expect.

Second, the reliance of existing BI tools on SQL doesn't leave much choice to information system architects. Popular BI systems like BusinessObjects, Cognos or Tableau can do well only one type of querying -- generate an SQL SELECT query with aggregation and filters (where/having conditions) and send it to a relational database. I call this single-step analytics (see "Transformational data analysis"). That's the only type of querying users can do with these tools. There are no good, user-friendly querying tools that would step out of this concept. The entire BI industry was tailored to the myth of data warehousing. Now it has become a power that forces architects for follow the myth.

OK, how to escape it? Here is my hypothesis:

If something big can't work as a tightly coupled system -- make it loose. Instead of forcing everything into strict global order, create order locally. Build small databases for subject areas (e.g. general ledger or customer loyalty programs) if needed, create collections of uniform files (without loading them into a database), pre-aggreggate data when necessary, etc. Make sure data is kept in order locally. Yes, this is very much like those "silos" that the data warehousing prescribes to avoid. Except that they are ordered, explorable, and ready for querying.

Second part of the hypothesis is more difficult as it requires something that doesn't exist yet -- user-friendly, visual , not SQL-based tools that can query, combine in multiple steps, and visualize data from various types of "silos". At small scale this can be done with EasyMorph. But for large amounts of data such tools should work in a distributed environment.

Finally, embrace the concept of "data kitchen". It's not possible to cover all data analysis needs of a big user group with a single BI system. The idea of BI standardization which was popular 5-7 years ago has failed. Having a single tool will never be enough. Instead, users should be offered on demand a choice of tools for various kinds of tasks. Think of "spoon", "fork" and "knife" of data analysis.

PS. Some readers can mention Apache Hadoop. While it looks like a step in the right direction (a loosely coupled system) there still is a big issue with tools. For instance, the PIG scripting language is powerful, but the whole idea of writing scripts is totally not user friendly. And no, putting Tableau on top of Hadoop won't make the trick as Tableau (or any other SQL based tool) is a tool from the Data Warehouse Myth.

August 18, 2015

Transformational data analysis

Single step analytics
The vast majority of BI or Data Discovery tools follow the same approach for data visualization and analysis. I call it 1-step analytics or single pass analytics. In the foundation of this approach there is a single logical data set consisting of one table, or several linked tables. Sometimes it can span across several data sources, but from a user's perspective it's still a single data set or cube. In order to perform analysis a user interacts with different parts of this data set. Visual objects of a report or dashboard are usually built on top of a subset of this data model, or microcube. In another words, under any chart or table in a report or dashboard there is a microcube. In a standard case, every microcube is obtained by filtering or aggregating data from the main cube, usually on the fly. Some BI tools allow users freely change measures and dimensions of microcubes on the fly (query&analysis tools like BusinessObjects or Tableau). Sometimes microcube metadata is fixed during design time and users can only filter data in it (Qlik). But in any case these microcubes are derived from the main cube. So there is only one step (pass) -- derive a microcube from the main cube.

Single-pass analytics

To derive a micro-cube typically 4 operations are used:
  • Select columns -- take only certain columns from the main cube
  • Filter -- keep only rows that satisfy some rule or condition
  • Aggregate -- calculate aggregates like sum or count, grouped by some dimensions
  • Calculate new columns -- calculate new measures or dimensions using a formula
 When users perform analysis they actually force BI tools to recalculate microcubes on the fly, using different parameters. For instance, when you drill down from year to month you tell your BI tool to select different columns (add month), apply a different filter (fix year), and aggregate by a different dimension (month instead of year). The power of BI is in the fact that all these operations are performed automatically by a single click. Whatever you, as user, do -- your BI tool automatically does these 4 operations under the hood.

So far, so good. Is anything wrong with this?

Multi-step analytics

For many users and cases, single step analytics is totally sufficient. Remember the times when all users had was just static reports. Probably we could've called that zero step analytics :) So the current state of affairs is a great improvement compared to those times.

But for many cases (and users) it's not enough. In the real life there are many business rules and types of analysis that can not be covered with only single pass. They need two or more passes in which microcubes are derived from another microcubes and not only from the main cube. For instance different kinds of customer behavior analysis require analyzing customer performance over a period of time (one pass), then grouping them based on this performance (another pass), and finally obtaining performance of the groups over the same or different time period (third pass). Example: for a retail chain it's important to see growth of their customer base and not just growth of sales. For this, the organization might analyze how many new customers every month became permanent buyers. But in order to understand if a customer that joined in, say, March is permanent, it's necessary to analyze his/her purchases from April to, say, October. And only then we can come to conclusion that, for example, 3% of new customers joined in March became permanent. And then calculate the same for all months. And then let the user experiment. For instance, modify the rule how we consider a customer permanent -- change it from "1 purchase over 3 months" to "2 purchases over 6 months", and see what happens.

Multi-step analytics

Number of cases when users need ad hoc multi-pass analytics will only grow because as organizations learn more about their customers, they slowly move from basic metrics like number of orders or total revenue to more sophisticated performance indicators that monitor key drivers of business.

You might argue that the type of tasks I described above is not unheard of, and is typically solved by the means of ETL. That's true. The common wisdom across BI developers is try to pre-calculate everything that cannot be calculated on the fly. Move it into ETL. But this doesn't really work because ETL is static. Well, it's not static for a developer, but for a user it's static. The reason it's static for the user is because designing ETL requires technical skills and users don't have them (and shouldn't have). You know how users get around this problem? They do ad hoc ETL in Excel. Yes, it's horribly inconvenient, very error prone, and requires a lot of tedious manual work, but what else can they do? They simply don't have a choice. At least Excel is something they are comfortable with.

ETL today is the same thing as static reporting was before BI started to prosper. I believe it will change with transformational data analysis.

Transformational data analysis

We've used to the fact that ETL and BI are different beasts. It's like a dogma. But what if the borderline between BI and ETL is somewhat artificial and shouldn't be that distinct? I'm not talking about low-level ETL that for instance integrates legacy systems. I'm talking about these parts of business logic that are moved to ETL simply because current BI tools can't handle it.

So, I'm proposing a new term -- "transformational data analysis". It's a way to analyze data through ad hoc data manipulation and multi-step analytics built as series of transformations. It effectively eliminates the difference between BI and ETL (in its business logic part).


EasyMorph (http://easymorph.com), the tool I've been working on since 2013, follows the concept of transformational data analysis. It allows non-technical users to build multi-step analytics using more than 20 various transformations (not just 4), and then re-run it with different parameters and modify it on the fly. At this point EasyMorph doesn't look like a traditional BI tool in that sense that it doesn't have interactive charts or pivot tables (yet!), but we're getting there.

PS.

Can Qlik do multi-pass analytics?
QlikView (and Qlik Sense) is somewhat different from most BI tools (including Tableau) in that sense that it allows going slightly beyond the 1-step limit. The set analysis feature allows building rather complex filtering conditions that might include the element functions ( P() and E() ) which can be considered a 2-step logic. Also, with the help of aggr() function you can add an extra aggregation step. But there are plenty cases where they can't help. And even if they can help, designing expressions with set analysis and aggr() is a huge hassle (I did it for years) and hardly can be considered user friendly or suitable for ad hoc workflow. To be fair we can assume that Qlik allows 1.5-step analytics.

UPDATE 16/3/2016
Starting from version 2.8 EasyMorph offers dynamic drag-and-drop charts for interactive data visualization and more than 50 transformations.

UPDATE 9/8/2015
Interesting comment from Christophe Vogne:

Hi Dmitry,

Reading again your article I understand better what you mean.
From my perspective you are highlighting the fact that BI is moving from multidimensional database to graph database.
Multidimensional database need to be strongly structured and this design break the hidden links between information if they haven't been considered.
With kimball/Inmon BI method, there's always somebody that decide for you what you are supposed to discover: the datawarehouse team and their cascading cubes, datamarts...
QlikView is 1.5 because it's a tabular database (the fields values storage) on top of a graph database (the pointers layer that make the links between values). So some lost associations can be rebuilt by users.

So one aspect of the BI future is graph database because users need to link any information in any context at any time.
But to aggregate values on graph database is a tough challenge (the Set Analysis) and to manage multiple edges between vertex (the synthetic keys) is tougher.

Interesting article indeed

March 5, 2015

EasyMorph as an ETL for Tableau

Tableau is a great tool. I've been watching it for a few years and I like the way it's developing -- more sophisticated computations, better performance, faster visual engine. Tableau aims at analysts without technical background -- an audience which probably is most under-served in terms of tooling than any other category of office workers. All what they usually have for their data analysis needs is Excel, love it or hate it.

At the same time I struggled to understand the conceptual breakthrough behind Tableau. While it's often considered a prominent Data Discovery platform, when it comes to data transformation it's not significantly less dependent on IT staff than traditional Business Intelligence platforms. Just as traditional BI, Tableau needs well prepared data, preferably residing in a database. And when it comes to data manipulation in databases all user-friendliness ends -- last time when SQL was user-friendly was in 1980s.

In my understanding the reason why Data Discovery started outpacing traditional BI is that it can liberate business teams from dependency on IT folks. Data Discovery tools must be self-sufficient by definition. It means that users should be able to collect, clean, transform and prepare data for analysis themselves. And this is why they still love Excel -- because it makes it possible, because it lets them control. And that's why QlikView is more self-sufficient -- because it has its own ETL. While QlikView has its own pros and cons (personally I'm not a big fan of its loading script), but in vast majority of cases it has all you need to prepare data for analysis and visualization. But what about Tableau?

I've designed EasyMorph, an easy-to-use ETL tool intended for exactly the same target audience as Tableau -- knowledge workers without a technical background. Like Tableau, EasyMorph is highly visual and it doesn't require SQL skills or programming. Like Tableau, it's fast and lightweight, and it doesn't demand weeks of training. My goal is to make EasyMorph a perfect companion for Tableau and allow Tableau to become a truly Data Discovery platform, owned by business users. Today EasyMorph made one more step towards that goal -- we've added support for Tableau Data Extracts.

If you're a Tableau user, give EasyMorph a try -- maybe this is something that you were missing in your Tableau experience. Feel free to drop me a few lines with your thoughts on it. You can find my email in the right sidebar of this blog. Thank you!

UPDATE
In 2015 EasyMorph has become a Tableau Technology partner. It has got a server edition and deeper integration with Tableau Server.

UPDATE #2
Apparently Tableau understands the lack of built-in data preparations capabilities -- in October 2017 they've unveiled Tableau Maestro, a light-weight data preparation tool. You can think of EasyMorph as "Maestro on steroids".

November 12, 2012

Impressions from Tableau in comparison with QlikView


I had the chance to get to Tableau Customer Conference in early November 2012 and thanks to exceptionally good organization of the event I was able to greatly enhance my picture of Tableau (which I first reviewed 2 years ago) and get answers to some questions.

Below are my impressions from Tableau (which I haven't used in real projects yet) in comparison with QlikView -- tool I've been working with since 2009.

First thing I'd like to tell -- starting from version 8 Tableau can honestly be considered a truly mature product -- a big difference with what I saw two years ago. It's a smartly designed, feature-full and powerful analytic tool which is especially good for ad hoc query and analysis (Q&A). Prior to Tableau I considered BusinessObjects WebIntelligence to be the best Q&A tool on the market. However, in my picture of BI world this honorable title now belongs to Tableau.

Here is what I liked (not in order of importance):

State-of-art data visualization makes Tableau outstanding in the crowd of BI suites. Tableau people talk about "being creative with data" and it's easy to believe in this while looking at clean and elegant Tableau dashboards. By the way, in French tableau has two meanings -- painting and table. Artwork and data. Excellent match of brand and product concept.

Drag-n-drop authoring as cornerstone of analysis and design processes. That's what WebIntelligence was good at, but Tableau makes it even better, simpler and easier. Sadly QlikView has almost nothing to offer here -- fields still have to be picked from a cluttered properties dialogs and dashboards have rather static layout.

In Tableau there are (at least) two special types of dimensions: time and location. I like the idea of special dimensions in general because indeed some dimensions should be treated differently for more efficient analysis and Tableau demonstrates this very well. For instance location dimensions can easily be used for maps and spatial analysis. Time dimensions should be treated differently as well because almost in all cases information is relevant only in specific time context.

Maps is one of the strongest features in Tableau. Usually maps is a real pain for BI developers because support for maps usually is rather poor in BI platforms. Some of them provide mapping functionality via integration with 3rd party GIS platforms like ESRI or MapInfo. But level of integration is never good enough, not to forget additional licensing costs. Some (e.g. QlikView) imitate mapping by offering maps simply as a colorful background for scatter charts, without important capability of highlighting regions or providing additional visual layers. Tableau has done a good work here and offers excellent mapping functionality which includes regularly updated maps and complimentary information (e.g. population or income) licensed from 3rd parties (without any additional costs for customers).

Groups and Sets. Ability to dynamically group dimensions is not something unseen before in BI suites (e.g. in Cognos). However, creating naming sets on the fly, applying set algebra operations (introduced in Tableau 8) to them like addition, intersection, subtraction and calculating aggregates against sets is a very useful and practical feature, for some reason underestimated and neglected by major BI vendors. I can recall only BusinessObjects Set Analysis which was quite clumsy last time when I saw it a few years ago.

QlikView has not much to offer here. While it is possible to save different selections into bookmarks it's not possible to apply set algebra to them. Comparison of aggregates of two ad hoc sets is possible but requires knowing rather complex set analysis expression syntax which is a non-trivial task for even advanced business users. How many of them are capable to quickly write something like this?


sum({Set1<Year=$::Year, Month=$::Month>} [Amount]) - sum({Set2<Year=$::Year, Month=$::Month>} [Amount])


Despite developers of a QlikView application can implement comparison of sets in a dashboard, it's not available out of the box. Dynamic grouping (of dimensions) is not possible in QlikView at all -- grouping requires creating additional data structures and reloading the application.

Now let's talk about some disadvantages of Tableau.

Performance. Working with QlikView it's easy to forget what performance optimization is. Surely, there are some tricks how to improve performance for very large datasets (hundreds of millions of records) but this question rarely appears in daily agenda of a QlikView developer. Having subsecond response time on 20 millions of records even on a laptop is not something unusual. However, I suspect that question of performance optimization will rise much more often for Tableau applications which heavily rely on relational databases. And that's not so trivial task as it may seem.

SQL query optimization is not a trivial task itself and may include special indexing strategy, joins optimization strategy and use of various hints and tricks -- task that requires experienced database professionals and is simply impossible for a business user (who has a lot of other things to do besides query optimization).

However that wouldn't be so dramatic if that was the only thing to do. Tableau enhances source data with its own data (e.g. calculated fields, dynamic groups, sets, latitude and longitude for locations) and also makes in-memory cross-source joins. Therefore query optimization requires good understanding of how Tableau performs these operations under the hood, how it interacts with database and what are implications of different settings. This makes task of performance optimization even less trivial.

I've got impression that performance is not something that Tableau is ready to boast about. Calculation in-memory engine is much weaker and far not so sophisticated as QlikView's one. Not significant but interesting detail -- two demo databases in standard Tableau desktop installation have only 4'248 and 8'399 records respectively.

One more reason for concern is that both Tableau Desktop and Tableau Server exist only in 32-bit version. We were told that 64-bit version is being actively developed however as of now the only version available for customers is 32-bit.

Having in mind these concerns about performance I'm not sure that ability to directly work with very large datasets really becomes an advantage on practice. Yes, theoretically it's better to be able to query 10TB of data than not to be. But would it have any practical use if this could require a few hours of waiting time?

Advanced authoring. Contrary to QlikView, Tableau makes bet not on syntax and scripting but on various settings and actions performed via user interface. While it is good for fast start and early learning curve, as complexity of dashboards increases it eventually leads to necessity of knowing various hacks, tricks and workarounds. For instance making objects (charts, tables, text labels) appear or disappear depending on some parameter (variable) is a straight forward task in QlikView but is actually a hack in Tableau. And that's not good, because in case of QlikView there is albeit complex but logical and well documented syntax but in case of Tableau you will need to learn these hacks and tricks from someone else. Because sometimes it's near to impossible to understand logic behind them without help of more experienced developer. So finally experience of a user becomes largely defined by amount of various collected hints and trick.

Use of screen estate. It's hard to compete with QlikView in efficiency of screen estate use. QlikView offers various gadgets, in-line minicharts, easy management of object visibility which allows making dashboards very information rich. While it's a usual thing for a QlikView dashboard to have 10 listboxes, having 10 quick filters (analogue of listbox) on Tableau dashboard will most probably make it completely cluttered and barely usable. Also such thing as in-line minicharts simply doesn't exist in Tableau.

Need for an ETL. As any other BI tool that heavily relies on database engine Tableau needs cleansed and transformed data. In general this also is true for QlikView. However since loading script in QlikView is capable to perform light ETL and data cleansing therefore in many cases this is sufficient enough.

Lack of collaboration activities --  while I'm not quite excited about the way data annotation is done in QlikView (here is my point of view on data annotation) however it's present at least in this form and instant application sharing is simply awesome feature  Tableau definitely needs something that would allow users discuss and share their findings.

Resume


Tableau is an excellent Q&A tool which is very well designed and suited for non-technical users. It is powerful, easy to use, highly visual and aesthetically pleasant. Good evidence that Tableau is a good fit for business users was audience of TCC2012 -- there were a lot of women and at the same time there were not many Indian developers which is not a typical case for a BI event.

However, promise of Tableau's execs and sales that "IT is not required with Tableau" is much less true than it might seem because involvement of IT personnel could be higher than expected as more complex dashboards become required.

QlikView applications usually require IT developers to create them, however the developers get much more flexible and powerful toolkit that allows them to create very information rich dashboards with fixed layout.

As vendor, Tableau is clearly on rise and the company seems healthy. Their product is developing rapidly, which unfortunately is not the case with QlikView -- I'm getting impression that QlikTech chronically under-invest in R&D and put too much on sales and marketing. There are lots of things in QlikView which wait to be modernized and improved very long time. However, its main killer feature -- ultra-fast in-memory engine -- is still unbeatable.

UPDATE (7/31/2015)
Since the time when this post was published Tableau has got a 64-bit version and greatly improved performance. Also, the data manipulation part now is less critical for Tableau with the help of  EasyMorph (http://easymorph.com) -- an easy-to-use visual data transformation tool for non-technical users created by the author of this blog.

Qlik in turn released QlikSense 2.0 which now is the company's flagship product. It has drag-n-drop dashbord authoring, redesigned security system and even faster in-memory engine. But the most interesting part of it is its highly customizable layout plug-in architecture that makes possible to insert literally any visualization into a dashboard.

November 9, 2012

Notes from Tableau Customer Conference 2012


I've been quite surprised with Tableau Customer Conference 2012. Briefly speaking -- that was the best vendor BI event I've ever been to (and I've been to quite a few). It's not because it was very well organized and there were several very interesting invited key speakers -- that's not what we're expecting from a BI conference. But because it was very practical and very specific. These guys had hundreds (literally!) of laptops in classes and tens of hands-on experience sessions dedicated to various subjects, like "What's new in version 8", "Geomapping", "Embedding", "Advanced calculations", "Performance tuning", "Administration" etc. which seemed to be more like short training courses rather than yet another boring presentations. Besides that there were at least 20 or something case studies and presentation from real customers from various industries. And to make it even more practical they brought there 700 Tableau employees ready to answer questions from customers and partners. Even if right person wasn't nearby -- it was relatively easy to find him/her with the help of organizers, despite any ranks and titles. I had no need to have meeting with CEO of the company, but I'm sure it could have been arranged if requested.

Well done, Tableau team!

PS. I'm preparing Tableau vs QlikView review and will be publishing it soon.