June 23, 2015

12 similarities between EasyMorph and QlikView loading script

Here are a few analogies that can help QlikView users become more familiar with data transformation concepts in EasyMorph:

In-memory data transformation

Both QlikView and EasyMorph don't require an external database to transform data. Instead, they rely on their own in-memory engines. In QlikView the data transformation part of the engine is single threaded. EasyMorph's engine is multi-threaded but less memory efficient. Both EasyMorph and QlikView use data compression.

Mixed value types in one column

Like QlikView, EasyMorph can mix text values and numbers in the same column, which makes it an excellent visual tool for parsing Excel spreadsheets. Although, type system in EasyMorph is a bit different.

Transformations in EM are similar to preceding loads in QV

In QlikView's preceding loads one load statement is based directly on the result of another load statement, which sometimes is convenient. Transformations in EasyMorph are somewhat similar to preceding loads in QlikView in that sense that a transformation directly uses the output of its previous transformation as input, without any intermediate (resident) tables. While in QlikView you can't do much in preceding loads -- only calculate new columns, and de-duplicate data (using DISTINCT), in EasyMorph you can use any of 25+ transformations (including filters, sorts, and even joins) in any order. Basically, all transformation process in EasyMorph is designed like super-powerful preceding loads.


Little things like the ability to replace existing column with an expression (instead of calculating new column, dropping the old one, and renaming) make life easier. And no annoying script errors because of a missed comma that cause aborting and reloading entire application.

Variables

Variables are ubiquitous in QlikView loading scripts and sometimes used up to the point where entire parts of script are replaced with a variable. The closest (although not exact!) analogue to variables in QlikView are project parameters in EasyMorph. Parameters are global. They don't change from transformation to transformation. Parameters can be used in transformations instead of file names and other properties, and also in expressions as constants.

Loops and iterations

Loading several files or processing a list of dates can be done using loops in QlikView, or iterations in EasyMorph. Although, the loops are imperative (as is the loading script syntax), while the iterations follow the functional programming style.

QVDs

No wonder QlikView can read/write QVD files. But so does EasyMorph. QlikSense QVDs are not supported yet (as of version 1.8) -- we're expecting Qlik to publish a respective API.

Calendars

Almost every QlikView / QlikSense application requires a calendar. If you're lucky to use Rob Wunderlich's QlikView Components then calendars might be easy for you. But for EasyMorph users it's even easier as it has built-in Calendar transformation that creates a calendar in a few clicks. See below an example of Calendar transformation, and its result.

Click to zoom

Mapping tables

Mapping table is a special temporary two-column table in QlikView. In EasyMorph any table can be a mapping table when it's used in Lookup transformation (equivalent to MAP USING... in QlikView). At this point (ver.1.8) in EasyMorph there is no analogy to ApplyMap function in QlikView.

Resident tables

In QlikView you can create new tables based on previously loaded, so called resident tables. In EasyMorph for the same purpose you can use derived tables. A derived table is like a dynamic copy (or view) of another table. It updates automatically if the original table changes. You can derive multiple tables from one table.

Derived tables in EasyMorph. Click to zoom.

Keep / Exists

Sometimes it's necessary to filter one table based on values in another table. In QlikView it can be done using either KEEP statement or WHERE clause with EXISTS() function. In EasyMorph the same can be achieved using Keep Matching or Keep Mismatching transformations.

Crosstable Load

Unpivot transformation in EasyMorph is the equivalent of CROSSTABLE LOAD in QlikView and can be used for transforming matrix tables into straight tables.

Command-line mode

Both QlikView and EasyMorph can be run in command line mode. Both applications allow defining variables (parameters) from command line. Here is EasyMorph's command-line syntax.

As you can see there are quite a few similarities. While in general QlikView loading script is more flexible (as you would expect from a programming language), designing transformations in EasyMorph is simpler, faster, and can be done by people without programming skills at all.

To learn more how EasyMorph works take a look at our illustrated PDF tutorials.

PS. One more similarity will appear in future releases -- the analogue of subroutines.

PPS. Totally forgot about resident/derived tables. Now it's 12 similarities :)

June 17, 2015

The world needs an open source columnar data file format

It's now common wisdom that storing data in columns is more convenient for analytical systems, than dealing with row-based data. Columnar databases like Vertica or VectorWise are getting widely adopted. Analytical in-memory engines are almost always columnar. QlikView stores data in QVD files in a columnar format, and I suspect that Tableau Data Extracts are columnar as well. EasyMorph is also running a columnar in-memory engine.

Usually, we see ETL processes that move data from row-based transactional systems into either row-based databases, or into columnar databases or analytical engines. In other words, the transfers are row-based to row-based, or row-based to columnar. But now, when columnar data stores become more and more widespread, the need to move data from one columnar system to another columnar system (i.e. columnar-columnar) will arise more and more often. And here is a problem -- if we do it in the usual way it's highly inefficient.

The reason it's inefficient is that columnar data is usually compressed. Therefore, passing a columnar dataset from one system to another system usually requires decompressing it entirely, than exporting it into some row-based format like CSV and then compressing again in the target system. Doesn't sound very efficient, does it?

To my knowledge (correct me if I'm wrong) at this point there is no any publicly available columnar data interchange format. For some reasons (which I don't really understand), all major vendors keep their columnar data formats proprietary, as if it was rocket science. I believe that if, for instance, Qlik made their QVD format open-source, then it could become a de-facto standard, simply because there is no any other common columnar data format. But as the vendors keep ignoring this opportunity, I believe there is a need in an open source format. Here is what it could be:

1. Columnar. Values are grouped into columns. A dataset can consist of one or more columns.

2. Extendable. Every column can be of one of predefined types, and these types encapsulate all logic required to read/write a column. Types can be:
  • Uncompressed
  • Vocabulary compression
  • RLE compression
  • Zipped
  • etc.
New versions of the format can include new column types, and preserve existing ones thus enabling backward compatibility.

3. Mixed/Strict typing. Some columns can have values of mixed types (e.g. text and numbers), some can be restricted to one type only.

4. Single-file/multi-file. Metadata and data can be in the same file (which is good for portability). Or metadata and columns (or parts of columns such as vocabularies) can be separate files (which can allow, for instance, sharing vocabularies between different columns and even tables).

5. Null-friendly. CSVs can't store nulls. This format should be able to support nulls natively.

I believe such format would make columnar-to-columnar data transfers more efficient. It won't eliminate decompressing/compressing entirely, but:
  • It would be possible to transfer only needed columns
  • In case where both source and target systems support the same column types (e.g. vocabulary compression) encoding/decoding can be either greatly optimized or avoided entirely
  • Metadata would be pre-calculated and available at low cost (e.g. number of rows, existence of nulls, etc.).
  • Columnar format makes parallel processing much simpler and more efficient

As the result -- data transfers can be 10x-100x times faster. One common format means we need not N x N data converters, but only N. Standardization would also foster a tool ecosystem around it -- viewers, profilers, converters, etc. Single documentation. Single API.

At this point it's just an idea. But if we at EasyMorph ever decide to make a persistent storage for our in-memory engine, I don't see any reasons why not make it open-source.

It's not rocket science after all.

UPDATE 17 Feb 2016
Two open-source projects aimed to standardize columnar data exchange - Apache Parquet (persistent store) and recently announced Apache Arrow (in-memory store).

June 14, 2015

EasyMorph as a visual functional programming language

If you're familiar with functional programming you might have noticed that EasyMorph is actually a functional programming language. Unlike general-purpose functional languages like Lisp or OCaml/F# it doesn't have writable code because it's visual. But it has many of the core features of functional languages:

Type system

EasyMorph's type system is rather primitive:
  • Dataset -- a set of columns that represents a table state before or after a transformation
  • Transformation properties -- a group of various transformation properties like file name, expression, boolean flag, etc.

    Immutable identifiers

    As in any other functional language, EasyMorph doesn't have variables. Instead it binds values to immutable identifiers. In our case identifiers can only be bound to datesets and project parameters which substitute some transformation properties.

    Functions

    Every transformation in EasyMorph is basically a function. It takes one or two datasets and/or a set of transformation properties as arguments, and returns one dataset. For instance:

    let A = Deduplicate B

    Since an EasyMorph project can have parameters, that makes entire project a function as well, where the parameters are the function arguments. In this case, the returned value is a dataset. While in programming languages a returned value is usually the last expression, in EasyMorph project the resulting table is simply marked with a flag, and its final dataset is returned to the calling project.

    Function pipelining

    Functions (transformations) can be pipelined (chained):

    let A = ImportText fileName
            |> Filter (fun x -> x.Year = 2015)
            |> Deduplicate
            |> Trim 10 topRows

    Iterate, map and fold

    Iterations in EasyMorph actually perform iterations, mapping and folding:

    When Iterate transformation is used in Iterate mode it's basically similar to Seq.iter or Seq.map in OCaml/F#

    When Iterate transformation is run in Iterate & Append mode it's somewhat similar to Seq.map |> Seq.fold as it creates multiple datasets, and then concatenates them into one dataset.

    Function values

    In functional languages functions can be passed as parameters. In EasyMorph one project can run another project and name of that other project can be defined by a parameter, which basically allows passing functions (projects) as parameters to other functions (projects).

    Resume

    Of course, this analogy is not very strict and it has many limitations. For instance there is no any equivalent of recursion which is a corner stone feature of functional languages. Nevertheless, it gives some interesting ideas on how a transformation process can be organized in EasyMorph. For instance, it should be convenient to compose transformation processes from smaller reusable projects (should we rather call them modules?). Also such functional approach makes developing and debugging easier, as it's possible to split the logic into small relatively isolated functions that don't have side effects.

    If you find this analogy interesting and would like to discuss it -- feel free to shoot me an email.

    UPDATE (8/30/2015)
    One more similarity appeared recently:

    Assert 

    Halt on condition transformation is basically the same as assert statement in some languages. It stops project execution if some condition is unfulfilled and throws a customized error message.

    March 22, 2015

    Data transformation in QlikView without the loading script

    While I admire QlikView's genius associative in-memory engine I'm not a big fan of QlikView's loading script. If QlikView wasn't meant for departmental use, it would not have been a problem. But since QlikView is heavily oriented on business departments with limited IT supporting staff, the necessity to deal with transformation logic encoded in a proprietary script syntax is an obstacle because of several reasons:
    1. It makes it harder to promote QlikView in organizations, since readability of QlikView script is no better than of Visual Basic macros in Excel spreadsheets or SQL.
    2. Since business users usually can't write/read the scripts (they are not supposed to have programming skills), it inflates development and maintenance costs because even minor changes to the logic have to be made by developers and developers have to answer all questions about how this or that is calculated.
    3. Total lack of metadata lineage. To make it even worse, the dollar-sign expansions make it impossible to parse scripts and rebuild abstract syntax tree in external applications.
    With QlikSense the situation is even worse, because QlikSense is targeted as a self-service data discovery platform, but the need in loading script makes it dead on arrival.

    I believe that data transformation can be done without programming in the vast majority of cases. That's why I designed EasyMorph that can be integrated with both QlikView and QlikSense.

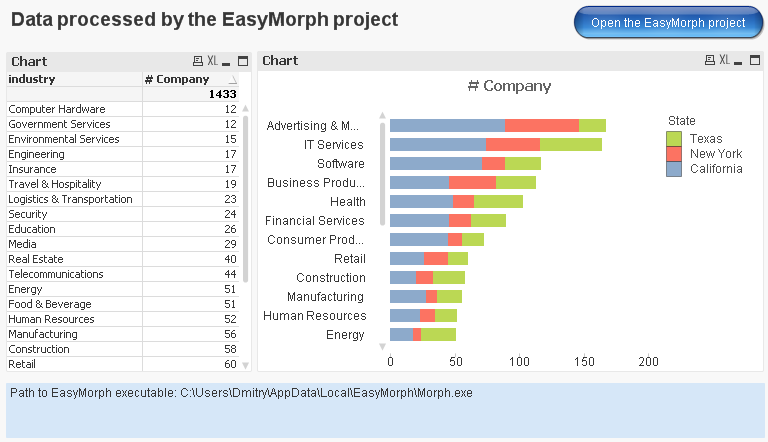
    Today we've published an example of QlikView Integration. It shows how data transformation logic can be moved from a QlikView loading script into an EasyMorph project, where it can be visually designed, modified and viewed. While it doesn't replace the loading script completely (yet) it demonstrates how core transformation logic can be made accessible for non-technical users, who can now explore and modify the logic in a visual way, without dealing with the script syntax.


    Here is its transformation logic. Input and output transformations are marked on the screenshot.


    The logic loads a text file (one file per state), maps state names from another file, does a few calculations and aggregations, and exports the result into a QVD file. Here is the loading script with EasyMorph project integration (comments removed, download the example for the full version):

    States:
    LOAD * Inline [
    State
    California
    New York
    Texas
    ];

    LET pathEasyMorph = GetRegistryString('HKEY_CURRENT_USER\Software\EasyMorph', 'ApplicationPath');

    let vCount = NoOfRows('States');

    FOR I = 0 to vCount - 1

        LET State = Peek('State', I, 'States');
       
        //create input file for the EasyMorph project
        EXECUTE cmd /C copy /Y "Inc5000 $(State).csv" input.csv;
       
        EXECUTE $(pathEasyMorph) /c /run "Inc5000 for QlikView.morph";   

        //read the QVD generated by the EasyMorph project
        LOAD
            *,
            '$(State)' as State
        FROM output.qvd (qvd);

    NEXT I


    Since EasyMorph can't process a list of files yet (this feature will be added in future releases) a simple workaround is used -- a cycle, that iterates through a list of file names, and renaming.

    For convenience the EasyMorph project can be opened right from desktop QlikView (in example there is a button for this).

    For server execution, you might need to specify the path to EasyMorph executable explicitly, since EasyMorph is installed under a user account and may not be available in the registry under QlikView Server's account.

    While it's not shown in the example, you can also add a link to the HTML documentation automatically generated by EasyMorph when it runs a project with /doc parameter from command line (see help on this). In this case users will be able to see the documentation right in the web-browser, next to the application. Or, right in the application, using an extension for web page embedding.

    Links:
    EasyMorph website
    QlikView Integration example

    PS. Technical details are copied from EasyMorph Blog.

    March 5, 2015

    EasyMorph as an ETL for Tableau

    Tableau is a great tool. I've been watching it for a few years and I like the way it's developing -- more sophisticated computations, better performance, faster visual engine. Tableau aims at analysts without technical background -- an audience which probably is most under-served in terms of tooling than any other category of office workers. All what they usually have for their data analysis needs is Excel, love it or hate it.

    At the same time I struggled to understand the conceptual breakthrough behind Tableau. While it's often considered a prominent Data Discovery platform, when it comes to data transformation it's not significantly less dependent on IT staff than traditional Business Intelligence platforms. Just as traditional BI, Tableau needs well prepared data, preferably residing in a database. And when it comes to data manipulation in databases all user-friendliness ends -- last time when SQL was user-friendly was in 1980s.

    In my understanding the reason why Data Discovery started outpacing traditional BI is that it can liberate business teams from dependency on IT folks. Data Discovery tools must be self-sufficient by definition. It means that users should be able to collect, clean, transform and prepare data for analysis themselves. And this is why they still love Excel -- because it makes it possible, because it lets them control. And that's why QlikView is more self-sufficient -- because it has its own ETL. While QlikView has its own pros and cons (personally I'm not a big fan of its loading script), but in vast majority of cases it has all you need to prepare data for analysis and visualization. But what about Tableau?

    I've designed EasyMorph, an easy-to-use ETL tool intended for exactly the same target audience as Tableau -- knowledge workers without a technical background. Like Tableau, EasyMorph is highly visual and it doesn't require SQL skills or programming. Like Tableau, it's fast and lightweight, and it doesn't demand weeks of training. My goal is to make EasyMorph a perfect companion for Tableau and allow Tableau to become a truly Data Discovery platform, owned by business users. Today EasyMorph made one more step towards that goal -- we've added support for Tableau Data Extracts.

    If you're a Tableau user, give EasyMorph a try -- maybe this is something that you were missing in your Tableau experience. Feel free to drop me a few lines with your thoughts on it. You can find my email in the right sidebar of this blog. Thank you!

    UPDATE
    In 2015 EasyMorph has become a Tableau Technology partner. It has got a server edition and deeper integration with Tableau Server.

    UPDATE #2
    Apparently Tableau understands the lack of built-in data preparations capabilities -- in October 2017 they've unveiled Tableau Maestro, a light-weight data preparation tool. You can think of EasyMorph as "Maestro on steroids".

    November 9, 2014

    Meet EasyMorph

    A few days ago EasyMorph, my new data transformation tool, went out from stealth mode and now Technical Preview is publicly available for downloading. It's time to tell a bit more about what this is.

    EasyMorph is the result of an attempt to rethink data transformation from scratch which gained momentum after my post in May 2013. There is a stereotypical understanding of what an ETL should be and it's inherited from traditional heavy-weight ultra-complex monsters like Informatica or Ab Initio. The thing is that this stereotypical approach poorly works for people without technical background -- those who we used to call business users. They don't know anything about join types and honestly they don't have to -- their heads are busy with business problems. At the same time the need to manipulate data becomes even more urgent as data discovery tools have become more popular and analytic systems become increasingly more often owned by business departments rather than IT staff.

    Excel, which is typically used for data transformations by business folks, has its own drawbacks that you're perfectly aware of:

    1) Excel is poorly suited for dealing with tables. Let me put it straight -- there are no tables in Excel. Tables are actually emulated with groups of cells. From Excel's standpoint there is no difference between column header, a column value or any random cell. Even worse -- Excel has no idea where a column starts and where it ends, which cells belong to a table and which don't. No wonder such emulation is prone to errors caused for instance by inaccurate stretching a formula over a range of cells.

    2) Debugging and maintaining table operations in Excel is a torture. Since table as an abstraction is missing in Excel it's hard to address table columns simply by names. You won't see something like Price = Amount * Qty in Excel when it comes to table operations. When you deal with an Excel formula you have to constantly decode what every reference actually means (e.g. column AT is Qty and column BC is Price). While formulas is a rather questionable way of defining a calculation (but that's another story) it would only be a half of the problem. Things get really bad when formulas are applied from within a Visual Basic macro (which is far not a rare situatuion) -- in this case you might not even be able to see the actual column, since it could be created or modified somewhere else earlier in the macro. So you have to decode the formula while keeping in mind program logic of the macro! Something tells me that this is not something that people enjoy doing.

    3) Excel is barely capable of multi-step transformations. Again, since the concept of table is missing in Excel, there are no table operations except maybe sorting and deduplication. At the same time sequentially applied transformations is the most natural way of transforming tabular data. This is what business users are trying to emulate in Excel. Just listen how they talk about it -- "Okay, Bob, what do we do with this data? Bob: First, get rid of all transactions with missing product names -- they're synthetic and we don't need them. Then for all the transactions with missing prices use the prices from the last year file. Once you get all prices in place -- calculate amounts. Don't forget to convert non-USD amounts to USD." and so on.

    Inconvenience of traditional ETL tools and the drawbacks of Excel led to several cornerstone concepts behind EasyMorph:

    1) Visual design. No SQL queries, no scripting or programming. All transformations are set up by only pointing-n-clicking and drag-n-dropping.

    2) Everything should be easily debuggable. Result of any transformation should be just one click away. Result of any expression should be easily tracked down to actual values (not done yet).

    3) Readability and  and maintainability. Business users should clearly see how this or that value is obtained. It shouldn't require decoding. It should be explained visually and automatically documented in plain English (not done yet).

    4) Fit technology to business users and not vice verse. If users don't understand SQL -- get rid of SQL. If users don't understand various types of joins -- don't stick to traditional joins, find a simple way how to represent the same operation.

    The screenshot below shows sample description of transformations in EasyMorph.
    Another interesting observation about multi-step transformations I made when I wrote loading scripts in QlikView. As a QlikView developer I wrote possibly tens of thousands lines of QlikView script. The more I wrote the more I noticed that all my scripts tend to have the same structure (a good topic for another blog post, btw). In particular, I noticed that it's natural to split loading script into rather isolated logical blocks (usually one block is placed in one tab) where each block generates a table with meaningful result. Temporary tables and fields used for producing this table are created and dropped withing the block. These resulting tables are not necessarily final. What's important about it that they encapsulate some logic, making it more or less isolated from other parts of script. Putting it differently, for other parts of the script it's not important how exactly I produced this resulting table, they just consume the result.


    This observation led to the idea of tables as transformation groups in EasyMorph which would represent such logical block. Effectively, every table in EasyMorph is a result of a group of transformations. In the picture above you can see that table "Census data" is result of a group consisting of 8 transformations. Clicking on any transformation would display intermediate output produced by this transformation (output of the 7th transformation is shown above).

    Another powerful abstraction in EasyMorph is derived table. Derived table allows re-using already calculated tables. Producing a derived table is the same as loading everything from a resident table in QlikView. Apparently you can produce as many derived tables as necessary. A derived table is just a regular table so it can be transformed as well.

    In the screenshot above you can see two derived tables produced from "Census data". Each of derived tables is further transformed in its own way.

    With the help of derived tables you can program rather complex logic. For instance you can split rows from the originating table into three groups based on some criteria, transform every group in its own way and then append all three groups back into one table. Another example - you can perform self-joins using derived tables.

    By the way, if you're familiar with functional programming, it could strike you that transformations in EasyMorph resemble function pipelining, and derived tables is the same as variable binding. To make it even more interesting, I can tell you that it is possible to introduce closures and iterations in EasyMorph which would effectively make it a functional machine.

    A few technical facts about first version of EasyMorph:
    • It's a 64-bit Windows desktop application with its own in-memory data processing engine.
    • It doesn't require external database.
    • Its first version comfortably deals with datasets up to 3-5mln rows.
    • No data compression yet.
    • 15 transformations that can run in parallel utilizing several CPU cores.
    • Data sources include delimited text and QVD files. Support for Excel files is expected in 2-3 weeks.
    • Expression syntax with 40+ functions.
    • It can run from command line
    Technical Preview is available at http://easymorph.com.

    UPDATE
    EasyMorph version 1.0 was released in February 2015 and is now actively developing. See http://easymorph.com.

    September 14, 2014

    Major redesign of QViewer

    It's been a while since I posted last time and now I've several posts and announcements waiting to be published.

    Today's post is about major QViewer redesign and update which has been due for a long time. I wrote first version of QViewer 2 years ago mainly for myself, although it was interesting to see if it can be useful for other QlikView developers. I turned out -- it can, and in the last 2 years it was downloaded more than 10'000 times (7'500 downloads of 64-bit version and 2'500 downloads of 32-bit version) with average number of downloads steadily going up.

    At the same time the utility remained to great extent what it was initially -- a custom-made "home-grown" software written during afterhours and in spare time, and it had good potential for optimization.


    Today, I'm releasing deeply updated and redesigned QViewer version 2.0 which is finally made comme il faut, i.e. -- as it should be. If you used QViewer previously you will notice new look and feel of the new version, however the majority of changes are under the hood. During the redesign the main focus was on performance and memory consumption that would allow using QViewer with large QVD files (up to 2GBs and more) comfortably. As the result, memory consumption was reduced in 5-7 times, and load speed has reduced in 5-10 times. For instance, load time for a sample 200MB file which I'm using for internal testing, has decreased from 17 seconds to just 1 second. Even more than that -- now load time depends only on hard drive speed, so if you have SSD -- you will enjoy even faster opening.

    Two other changes -- more responsive user interface better suited for larger displays, and replacement of Query (simple aggregation feature) with integration with another tool which will be released soon. Also the free version now allows twice more rows -- 100'000.

    Your existing license keys will keep working with version 2.0 so no replacement needed.

    Don't hesitate to try out new QViewer and let me know what you think about the changes.