
Dmitry Gudkov's blog about Business Intelligence and Data Visualization
March 17, 2013
Better Lineage in QViewer and some other updates
Here is a brief overview of features recently added to EasyQlik QViewer -- my favorite QVD viewer :) If you're subscribed to QViewer newsletter then you've heard about some of them except the most recent.

January 19, 2013
Using web-services with QlikView
There is a number of ways to establish bi-directional integration between QlikView and external systems. Some of them employ web-services. In this case a web-service is a helper application which sits between QlikView and external application (or is part of that external application) and communicates using web-protocols. Web-services can be written in any popular programming language (PHP, Java, C#, Python, Ruby, Go etc.) and hosted using popular web servers like Apache, IIS or nginx or any other of your choice.
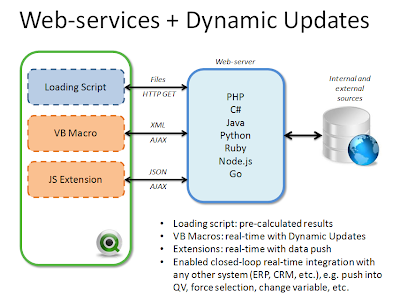
Let's consider several architectures:
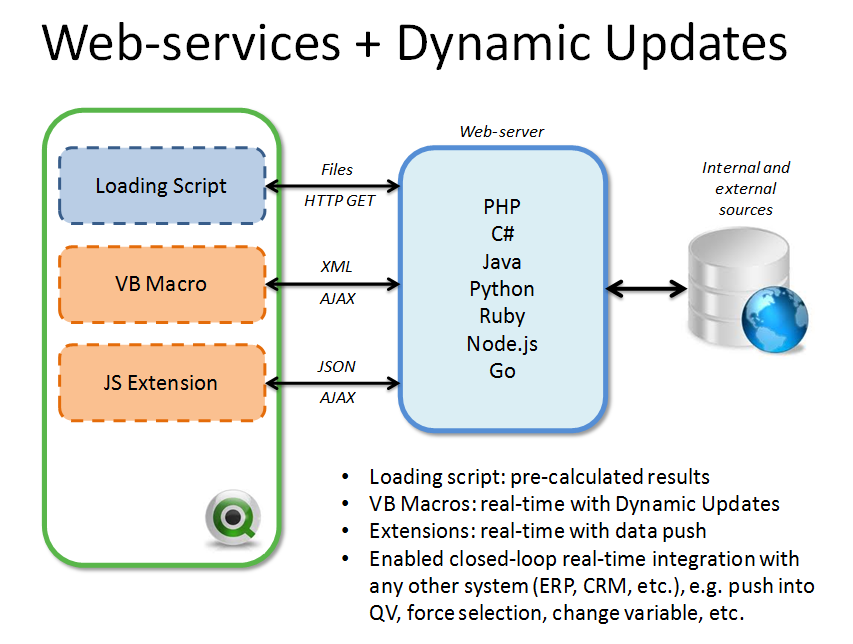
Let's consider several architectures:
December 26, 2012
Using Dynamic Updates in QlikView 11
Dynamic Updates is another one feature that makes difference between QlikView and other popular BI tools even bigger (see also "Really, is QlikView a BI tool?"). If you haven't heard about it -- it allows adding new or modifying existing data right in the in-memory data model of a QlikView application without re-running loading script. While this feature can be used (to some extent) for real-time updates, in my opinion the main benefit from it lies in a different area -- it enables creating closed-loop workflow with operational applications. It means that not only can you take data from operational applications (e.g. Salesforce or SAP), but return some user-generated output from QlikView into these applications as part of a single workflow. For example, in one of my applications a user can get a list of pending orders from logistic system, create batches from these orders based on some filters and selections in QlikView and then return these batches for delivery into the logistic application.
Dynamic Updates can be performed in two ways -- using VB macros (starting from version 10) and using Actions (starting from version 11). Using actions is a more preferable way (as VB macros are losing more and more favor with QlikTech). Unfortunately, documentation about Dynamic Update Actions is very scarce and there are lots of limitations and side effects, so I tried to collect here some practical hints and tips how it can be used:
Actions utilize SQL-like syntax (however very very limited). E.g.:
INSERT INTO * ('Batch ID', 'Order ID') VALUES (1, 'ABC123');
UPDATE Batches SET WrongBatch = 1 WHERE "Order ID" = null();
DELETE FROM Batches WHERE -1;
These commands look like SQL but here similarities end. Some of limitations:
$(=concat(DISTINCT 'INSERT INTO * (OrderID) VALUES ($(vNewBatch),'&[Order ID]&')', ';'))
On QlikCommunity there is excellent demo application made by Matthias Dix that shows basic Dynamic Update commands and their equivalent using VB macros (full thread here).
You should also keep in mind that there are some significant side effects from using Dynamic Updates which often lead to unpredictable behavior. This article explains very well these side effects and how to deal with some of them. I struggled with failed variable assignments (Set Variable action) in the same action batch with Dynamic Update, unexpected freezes, and that any Dynamic Update command for some reason triggers all OnSelect actions. Finally I came to this workaround:

UPDATE
Keep in mind that for server-hosted applications all changes made by Dynamic Update apply immediately for all users that are working with the applications. It means that you need to make sure that actions of different users working simultaneously won't interfere. It can be achieved, for instance, by adding user name for each record created by Dynamic Update and then using set analysis expressions to limit records to only those which are required for the user. But in any case, extra care should be taken to manage correctly all possible concurrency cases.
Dynamic Updates can be performed in two ways -- using VB macros (starting from version 10) and using Actions (starting from version 11). Using actions is a more preferable way (as VB macros are losing more and more favor with QlikTech). Unfortunately, documentation about Dynamic Update Actions is very scarce and there are lots of limitations and side effects, so I tried to collect here some practical hints and tips how it can be used:
Actions utilize SQL-like syntax (however very very limited). E.g.:
INSERT INTO * ('Batch ID', 'Order ID') VALUES (1, 'ABC123');
UPDATE Batches SET WrongBatch = 1 WHERE "Order ID" = null();
DELETE FROM Batches WHERE -1;
These commands look like SQL but here similarities end. Some of limitations:
- You can use equal sign (=) in WHERE clause. You cannot use greater (>) or less (<) signs or not equal (<>)
- You can combine conditions using AND or OR in WHERE clause. You cannot use NOT
- Check for nulls is done differently than in ANSI SQL (see example above)
- Notice different syntax for field names with spaces
$(=concat(DISTINCT 'INSERT INTO * (OrderID) VALUES ($(vNewBatch),'&[Order ID]&')', ';'))
On QlikCommunity there is excellent demo application made by Matthias Dix that shows basic Dynamic Update commands and their equivalent using VB macros (full thread here).
You should also keep in mind that there are some significant side effects from using Dynamic Updates which often lead to unpredictable behavior. This article explains very well these side effects and how to deal with some of them. I struggled with failed variable assignments (Set Variable action) in the same action batch with Dynamic Update, unexpected freezes, and that any Dynamic Update command for some reason triggers all OnSelect actions. Finally I came to this workaround:
- Put all variable assignments (Set Variable action) before Dynamic Update command otherwise new values of these variable won't be visible in expressions.
- Use some dummy command right after Dynamic Update to fight freezes, e.g. Set Variable for dummy (i.e. not used) variable, or even better ...
- ... use Selection -> Back action right after Dynamic Update command to compensate triggering all OnSelect events (won't have effect on VB Macros tied to OnSelect).

UPDATE
Keep in mind that for server-hosted applications all changes made by Dynamic Update apply immediately for all users that are working with the applications. It means that you need to make sure that actions of different users working simultaneously won't interfere. It can be achieved, for instance, by adding user name for each record created by Dynamic Update and then using set analysis expressions to limit records to only those which are required for the user. But in any case, extra care should be taken to manage correctly all possible concurrency cases.
December 15, 2012
QViewer rebranded, got paid version
 A few significant changes happened to QViewer -- viewer for QVD files which I wrote a few months ago and still continue developing.
First of all, QViewer has been re-branded as EasyQlik QViewer and got its own web-site http://easyqlik.com (which however doesn't differ much from the old one).
Second major change is that QViewer has now two versions -- free and full. Free version is limited to 10'000 rows which is still quite enough to do some data profiling. Full version is paid (license key can be purchased for $45) and unlimited. License is personal (i.e. limited to a person, not organization) and has no limitation by number of installations -- you can use QViewer on as much computers as you need. In 8 months the demo version was download almost 1'000 times so it gives me the hope that someone found it as much as useful as I do :) However, further development of QViewer in terms of features, usability and functionality will directly depend on number of licenses purchased as this will show if QViewer is really useful tool or not.
Third change is that finally I got rid of troublesome ClickOnce installer which caused lots of problems with installation and even more with uninstallation. Now QViewer comes with standard neat NSIS-based installer and actually is a portable application. It means that you don't necessarily need to run installer if you want to move QViewer to a different machine. Once it has been installed, you can simply copy qviewer.exe to other machine or add it to your portable apps collection on USB-stick. However, running installer has advantage of automated association with .qvd file extension, which can be problematic otherwise. And as previously, QViewer requires installed .NET v4.0 or above -- keep this in mind when using QViewer in portable mode.
Future development plans include adding sort functionality for listboxes and metadata tables, and design of custom data grid. The latter should significantly decrease load times as the current implementation uses standard DataGridView which is so slow that only initializing it actually takes major part of total load time.
And of course, if you have feature suggestions -- don't hesitate to give me a shout by email or in comments here.
How to look inside resident tables at any point of loading script
What do you usually do when you need to look inside a resident table somewhere in the middle of loading script? I guess you store it as QVD, then load this QVD in a separate temporary QlikView application, then create table box or something else to browse the table.
Here is small trick how you can make your life easier using QViewer:
Insert in the beginning of the loading script this short snippet:
SUB INSPECT (T)
LET vPathToQviewer = 'C:\User\Dmitry\AppData\Local\EasyQlik\QViewer\';
STORE $(T) into [$(vPathToQviewer)temp_qvd.qvd] (qvd);
EXECUTE "$(vPathToQviewer)qviewer.exe" "$(vPathToQviewer)temp_qvd.qvd";
ENDSUB
And then simply insert calls to this function in any place of the loading script where you need to inspect table in its current state. For instance:
CALL Inspect('Orders');
When execution of the loading script will come to this line it will open QViewer showing the table. Script will continue running as soon as you close QViewer.
This is convenient technique that allows inspecting resident tables after every transformation like joins, concatenate loads, etc. You can have as many inspection points as you need during a single run.
A few more tips:
You may receive Security Alert from QlikView because of EXECUTE statement as depicted below. Just press Override Security button. Or you can change security settings in the bottom of the Script Editor window.


You can put this snipped into some file (e.g. debug.qvs) and then include this file when you need to do debugging of some application. Also you might want to save inspected tables under their own names in some temporary folder -- just modify the snippet accordingly or add a new similar function, e.g. InspectSave.
Any more ideas?
UPDATE 1
+Donald Hutchins made a good point -- he offered to store temporary QVD file not in QViewer's folder but in the working folder of the appliction which loading script is being executed. I think it makes a lot of sense because of less problems with access rights and better fit for parallel use. Here is his variant with my minor changes:
SUB INSPECT (T)
STORE $(T) into [$(QvWorkPath)\~$(T).qvd] (qvd);
EXECUTE "C:\.......\QViewer.exe" "$(QvWorkPath)\~$(T).qvd";
EXECUTE cmd /c del "$(QvWorkPath)\~$(T).qvd";
ENDSUB
UPDATE 2
+Matthew Fryer proposes one more variant of the Inspect sub in his blog QlikView Addict.
UPDATE 3
You can use EasyMorph for exactly the same purpose -- inspecting resident tables. Pros: with EasyMorph you can do more than just viewing a QVD -- you can filter, aggregate, calculate new columns, join other tables, etc. Also the free EasyMorph doesn't have the limit of 100K rows as the free QViewer does. Cons: EasyMorph opens QVD slower than QViewer as it needs to convert them to its internal format. Also it's less memory efficient when it comes to large QVDs.
The only difference in script would be additional /load key:
SUB INSPECT (T)
STORE $(T) into [$(QvWorkPath)\~$(T).qvd] (qvd);
EXECUTE "C:\.......\morph.exe" /load "$(QvWorkPath)\~$(T).qvd";
EXECUTE cmd /c del "$(QvWorkPath)\~$(T).qvd";
ENDSUB
Here is small trick how you can make your life easier using QViewer:
Insert in the beginning of the loading script this short snippet:
SUB INSPECT (T)
LET vPathToQviewer = 'C:\User\Dmitry\AppData\Local\EasyQlik\QViewer\';
STORE $(T) into [$(vPathToQviewer)temp_qvd.qvd] (qvd);
EXECUTE "$(vPathToQviewer)qviewer.exe" "$(vPathToQviewer)temp_qvd.qvd";
ENDSUB
And then simply insert calls to this function in any place of the loading script where you need to inspect table in its current state. For instance:
CALL Inspect('Orders');
When execution of the loading script will come to this line it will open QViewer showing the table. Script will continue running as soon as you close QViewer.
This is convenient technique that allows inspecting resident tables after every transformation like joins, concatenate loads, etc. You can have as many inspection points as you need during a single run.
A few more tips:
You may receive Security Alert from QlikView because of EXECUTE statement as depicted below. Just press Override Security button. Or you can change security settings in the bottom of the Script Editor window.

You can put this snipped into some file (e.g. debug.qvs) and then include this file when you need to do debugging of some application. Also you might want to save inspected tables under their own names in some temporary folder -- just modify the snippet accordingly or add a new similar function, e.g. InspectSave.
Any more ideas?
UPDATE 1
+Donald Hutchins made a good point -- he offered to store temporary QVD file not in QViewer's folder but in the working folder of the appliction which loading script is being executed. I think it makes a lot of sense because of less problems with access rights and better fit for parallel use. Here is his variant with my minor changes:
SUB INSPECT (T)
STORE $(T) into [$(QvWorkPath)\~$(T).qvd] (qvd);
EXECUTE "C:\.......\QViewer.exe" "$(QvWorkPath)\~$(T).qvd";
EXECUTE cmd /c del "$(QvWorkPath)\~$(T).qvd";
ENDSUB
UPDATE 2
+Matthew Fryer proposes one more variant of the Inspect sub in his blog QlikView Addict.
UPDATE 3
You can use EasyMorph for exactly the same purpose -- inspecting resident tables. Pros: with EasyMorph you can do more than just viewing a QVD -- you can filter, aggregate, calculate new columns, join other tables, etc. Also the free EasyMorph doesn't have the limit of 100K rows as the free QViewer does. Cons: EasyMorph opens QVD slower than QViewer as it needs to convert them to its internal format. Also it's less memory efficient when it comes to large QVDs.
The only difference in script would be additional /load key:
SUB INSPECT (T)
STORE $(T) into [$(QvWorkPath)\~$(T).qvd] (qvd);
EXECUTE "C:\.......\morph.exe" /load "$(QvWorkPath)\~$(T).qvd";
EXECUTE cmd /c del "$(QvWorkPath)\~$(T).qvd";
ENDSUB
November 12, 2012
Impressions from Tableau in comparison with QlikView

I had the chance to get to Tableau Customer Conference in early November 2012 and thanks to exceptionally good organization of the event I was able to greatly enhance my picture of Tableau (which I first reviewed 2 years ago) and get answers to some questions.
Below are my impressions from Tableau (which I haven't used in real projects yet) in comparison with QlikView -- tool I've been working with since 2009.
First thing I'd like to tell -- starting from version 8 Tableau can honestly be considered a truly mature product -- a big difference with what I saw two years ago. It's a smartly designed, feature-full and powerful analytic tool which is especially good for ad hoc query and analysis (Q&A). Prior to Tableau I considered BusinessObjects WebIntelligence to be the best Q&A tool on the market. However, in my picture of BI world this honorable title now belongs to Tableau.
Here is what I liked (not in order of importance):
State-of-art data visualization makes Tableau outstanding in the crowd of BI suites. Tableau people talk about "being creative with data" and it's easy to believe in this while looking at clean and elegant Tableau dashboards. By the way, in French tableau has two meanings -- painting and table. Artwork and data. Excellent match of brand and product concept.
Drag-n-drop authoring as cornerstone of analysis and design processes. That's what WebIntelligence was good at, but Tableau makes it even better, simpler and easier. Sadly QlikView has almost nothing to offer here -- fields still have to be picked from a cluttered properties dialogs and dashboards have rather static layout.
In Tableau there are (at least) two special types of dimensions: time and location. I like the idea of special dimensions in general because indeed some dimensions should be treated differently for more efficient analysis and Tableau demonstrates this very well. For instance location dimensions can easily be used for maps and spatial analysis. Time dimensions should be treated differently as well because almost in all cases information is relevant only in specific time context.
Maps is one of the strongest features in Tableau. Usually maps is a real pain for BI developers because support for maps usually is rather poor in BI platforms. Some of them provide mapping functionality via integration with 3rd party GIS platforms like ESRI or MapInfo. But level of integration is never good enough, not to forget additional licensing costs. Some (e.g. QlikView) imitate mapping by offering maps simply as a colorful background for scatter charts, without important capability of highlighting regions or providing additional visual layers. Tableau has done a good work here and offers excellent mapping functionality which includes regularly updated maps and complimentary information (e.g. population or income) licensed from 3rd parties (without any additional costs for customers).
Groups and Sets. Ability to dynamically group dimensions is not something unseen before in BI suites (e.g. in Cognos). However, creating naming sets on the fly, applying set algebra operations (introduced in Tableau 8) to them like addition, intersection, subtraction and calculating aggregates against sets is a very useful and practical feature, for some reason underestimated and neglected by major BI vendors. I can recall only BusinessObjects Set Analysis which was quite clumsy last time when I saw it a few years ago.
QlikView has not much to offer here. While it is possible to save different selections into bookmarks it's not possible to apply set algebra to them. Comparison of aggregates of two ad hoc sets is possible but requires knowing rather complex set analysis expression syntax which is a non-trivial task for even advanced business users. How many of them are capable to quickly write something like this?
sum({Set1<Year=$::Year, Month=$::Month>} [Amount]) - sum({Set2<Year=$::Year, Month=$::Month>} [Amount])
Despite developers of a QlikView application can implement comparison of sets in a dashboard, it's not available out of the box. Dynamic grouping (of dimensions) is not possible in QlikView at all -- grouping requires creating additional data structures and reloading the application.
Now let's talk about some disadvantages of Tableau.
Performance. Working with QlikView it's easy to forget what performance optimization is. Surely, there are some tricks how to improve performance for very large datasets (hundreds of millions of records) but this question rarely appears in daily agenda of a QlikView developer. Having subsecond response time on 20 millions of records even on a laptop is not something unusual. However, I suspect that question of performance optimization will rise much more often for Tableau applications which heavily rely on relational databases. And that's not so trivial task as it may seem.
SQL query optimization is not a trivial task itself and may include special indexing strategy, joins optimization strategy and use of various hints and tricks -- task that requires experienced database professionals and is simply impossible for a business user (who has a lot of other things to do besides query optimization).
However that wouldn't be so dramatic if that was the only thing to do. Tableau enhances source data with its own data (e.g. calculated fields, dynamic groups, sets, latitude and longitude for locations) and also makes in-memory cross-source joins. Therefore query optimization requires good understanding of how Tableau performs these operations under the hood, how it interacts with database and what are implications of different settings. This makes task of performance optimization even less trivial.
I've got impression that performance is not something that Tableau is ready to boast about. Calculation in-memory engine is much weaker and far not so sophisticated as QlikView's one. Not significant but interesting detail -- two demo databases in standard Tableau desktop installation have only 4'248 and 8'399 records respectively.
One more reason for concern is that both Tableau Desktop and Tableau Server exist only in 32-bit version. We were told that 64-bit version is being actively developed however as of now the only version available for customers is 32-bit.
Having in mind these concerns about performance I'm not sure that ability to directly work with very large datasets really becomes an advantage on practice. Yes, theoretically it's better to be able to query 10TB of data than not to be. But would it have any practical use if this could require a few hours of waiting time?
Advanced authoring. Contrary to QlikView, Tableau makes bet not on syntax and scripting but on various settings and actions performed via user interface. While it is good for fast start and early learning curve, as complexity of dashboards increases it eventually leads to necessity of knowing various hacks, tricks and workarounds. For instance making objects (charts, tables, text labels) appear or disappear depending on some parameter (variable) is a straight forward task in QlikView but is actually a hack in Tableau. And that's not good, because in case of QlikView there is albeit complex but logical and well documented syntax but in case of Tableau you will need to learn these hacks and tricks from someone else. Because sometimes it's near to impossible to understand logic behind them without help of more experienced developer. So finally experience of a user becomes largely defined by amount of various collected hints and trick.
Use of screen estate. It's hard to compete with QlikView in efficiency of screen estate use. QlikView offers various gadgets, in-line minicharts, easy management of object visibility which allows making dashboards very information rich. While it's a usual thing for a QlikView dashboard to have 10 listboxes, having 10 quick filters (analogue of listbox) on Tableau dashboard will most probably make it completely cluttered and barely usable. Also such thing as in-line minicharts simply doesn't exist in Tableau.
Need for an ETL. As any other BI tool that heavily relies on database engine Tableau needs cleansed and transformed data. In general this also is true for QlikView. However since loading script in QlikView is capable to perform light ETL and data cleansing therefore in many cases this is sufficient enough.
Lack of collaboration activities -- while I'm not quite excited about the way data annotation is done in QlikView (here is my point of view on data annotation) however it's present at least in this form and instant application sharing is simply awesome feature Tableau definitely needs something that would allow users discuss and share their findings.
Lack of collaboration activities -- while I'm not quite excited about the way data annotation is done in QlikView (here is my point of view on data annotation) however it's present at least in this form and instant application sharing is simply awesome feature Tableau definitely needs something that would allow users discuss and share their findings.
Resume
Tableau is an excellent Q&A tool which is very well designed and suited for non-technical users. It is powerful, easy to use, highly visual and aesthetically pleasant. Good evidence that Tableau is a good fit for business users was audience of TCC2012 -- there were a lot of women and at the same time there were not many Indian developers which is not a typical case for a BI event.
However, promise of Tableau's execs and sales that "IT is not required with Tableau" is much less true than it might seem because involvement of IT personnel could be higher than expected as more complex dashboards become required.
QlikView applications usually require IT developers to create them, however the developers get much more flexible and powerful toolkit that allows them to create very information rich dashboards with fixed layout.
As vendor, Tableau is clearly on rise and the company seems healthy. Their product is developing rapidly, which unfortunately is not the case with QlikView -- I'm getting impression that QlikTech chronically under-invest in R&D and put too much on sales and marketing. There are lots of things in QlikView which wait to be modernized and improved very long time. However, its main killer feature -- ultra-fast in-memory engine -- is still unbeatable.
UPDATE (7/31/2015)
Since the time when this post was published Tableau has got a 64-bit version and greatly improved performance. Also, the data manipulation part now is less critical for Tableau with the help of EasyMorph (http://easymorph.com) -- an easy-to-use visual data transformation tool for non-technical users created by the author of this blog.
Qlik in turn released QlikSense 2.0 which now is the company's flagship product. It has drag-n-drop dashbord authoring, redesigned security system and even faster in-memory engine. But the most interesting part of it is its highly customizable layout plug-in architecture that makes possible to insert literally any visualization into a dashboard.
UPDATE (7/31/2015)
Since the time when this post was published Tableau has got a 64-bit version and greatly improved performance. Also, the data manipulation part now is less critical for Tableau with the help of EasyMorph (http://easymorph.com) -- an easy-to-use visual data transformation tool for non-technical users created by the author of this blog.
Qlik in turn released QlikSense 2.0 which now is the company's flagship product. It has drag-n-drop dashbord authoring, redesigned security system and even faster in-memory engine. But the most interesting part of it is its highly customizable layout plug-in architecture that makes possible to insert literally any visualization into a dashboard.
November 9, 2012
Notes from Tableau Customer Conference 2012

I've been quite surprised with Tableau Customer Conference 2012. Briefly speaking -- that was the best vendor BI event I've ever been to (and I've been to quite a few). It's not because it was very well organized and there were several very interesting invited key speakers -- that's not what we're expecting from a BI conference. But because it was very practical and very specific. These guys had hundreds (literally!) of laptops in classes and tens of hands-on experience sessions dedicated to various subjects, like "What's new in version 8", "Geomapping", "Embedding", "Advanced calculations", "Performance tuning", "Administration" etc. which seemed to be more like short training courses rather than yet another boring presentations. Besides that there were at least 20 or something case studies and presentation from real customers from various industries. And to make it even more practical they brought there 700 Tableau employees ready to answer questions from customers and partners. Even if right person wasn't nearby -- it was relatively easy to find him/her with the help of organizers, despite any ranks and titles. I had no need to have meeting with CEO of the company, but I'm sure it could have been arranged if requested.
Well done, Tableau team!
PS. I'm preparing Tableau vs QlikView review and will be publishing it soon.
Subscribe to:
Posts (Atom)